Logic Errors in Lambda Functions
Now that we’ve setup error logging for our API, we are ready to go over the workflow for debugging the various types of errors we’ll run into.
First up, there are errors that can happen in our Lambda function code. Now we all know that we almost never make mistakes in our code. However, it’s still worth going over this very “unlikely” scenario.
Create a New Branch
Let’s start by creating a new branch that we’ll use while working through the following examples.
 In the project root for your backend repo, run the following:
$ git checkout -b debug
Push Some Faulty Code
Let’s trigger an error in get.js by commenting out the noteId field in the DynamoDB call’s Key definition. This will cause the DynamoDB call to fail and in turn cause the Lambda function to fail.
Replace services/notes/get.js with the following.
import handler from "./libs/handler-lib";
import dynamoDb from "./libs/dynamodb-lib";

export const main = handler(async (event, context) => {
  const params = {
    TableName: process.env.tableName,
    // 'Key' defines the partition key and sort key of the item to be retrieved
    // - 'userId': Identity Pool identity id of the authenticated user
    // - 'noteId': path parameter
    Key: {
      userId: event.requestContext.identity.cognitoIdentityId,
      // noteId: event.pathParameters.id
    }
  };

  const result = await dynamoDb.get(params);
  if ( ! result.Item) {
    throw new Error("Item not found.");
  }

  // Return the retrieved item
  return result.Item;
});
Note the line that we’ve commented out.
Let’s commit our changes.
$ git add .
$ git commit -m "Adding some faulty code"
$ git push --set-upstream origin debug
Deploy the Faulty Code
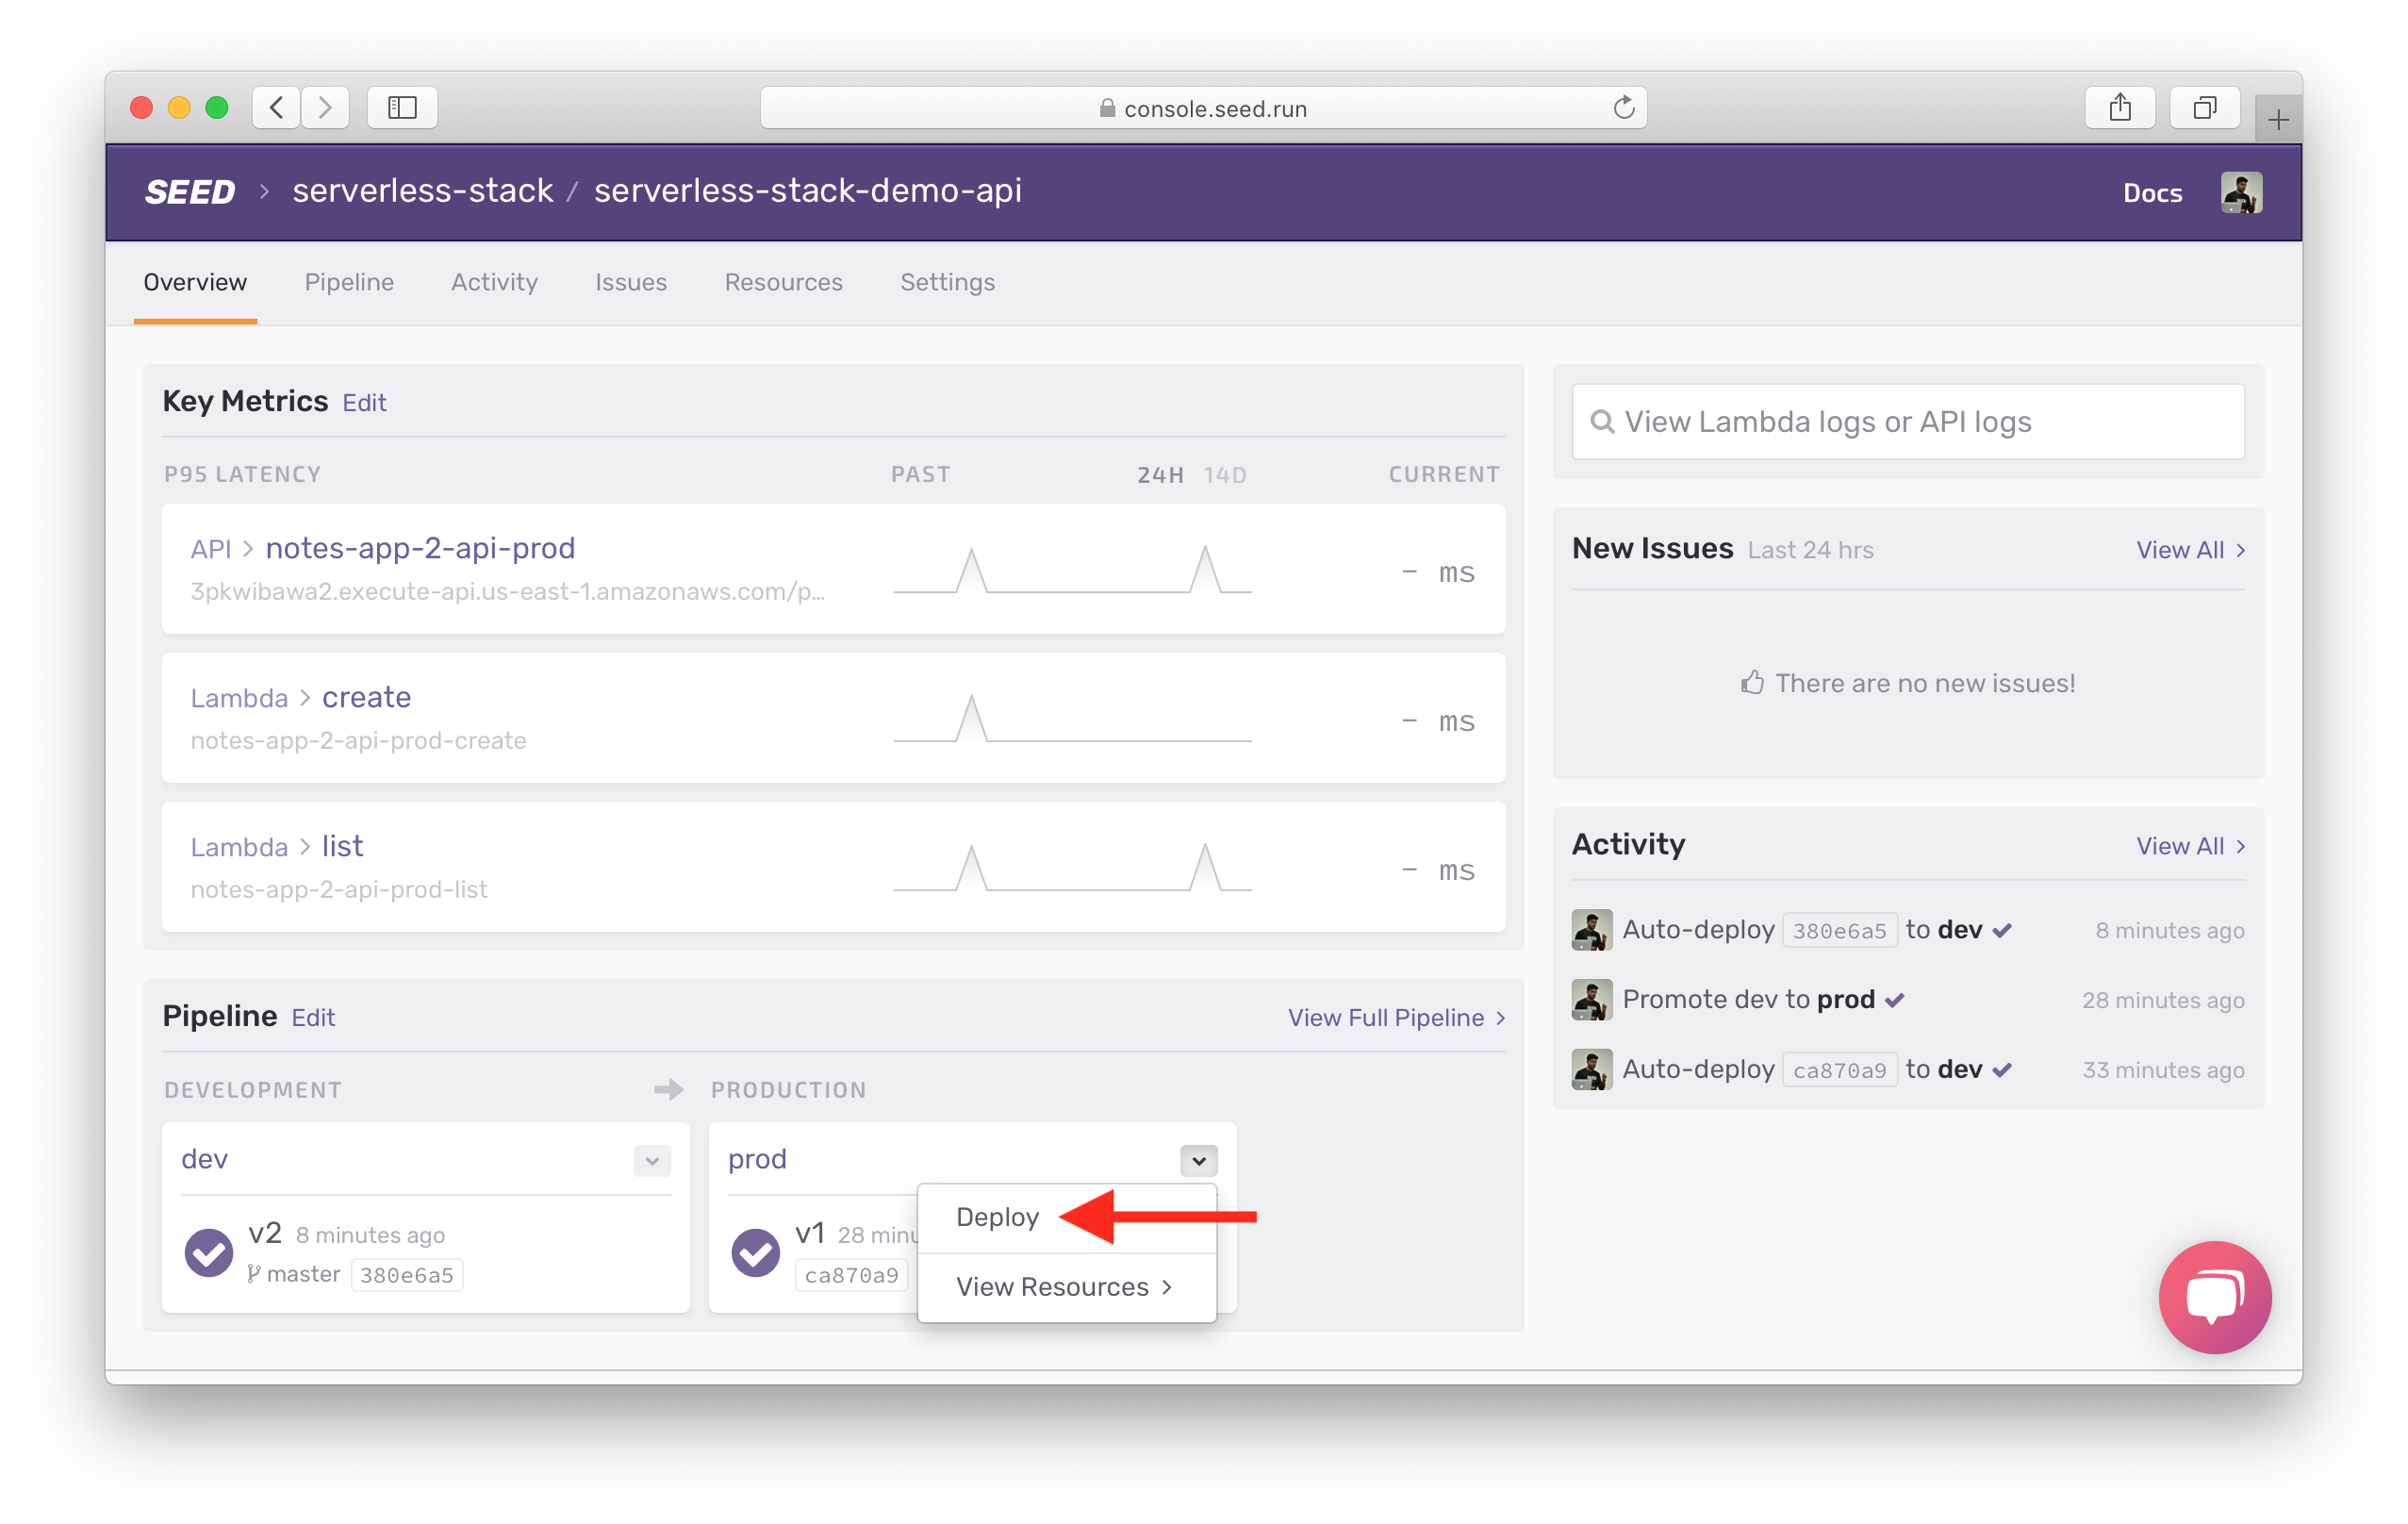
Head over to your Seed dashboard and select the prod stage in the pipeline and hit Deploy.
Select the debug branch from the dropdown and hit Deploy.
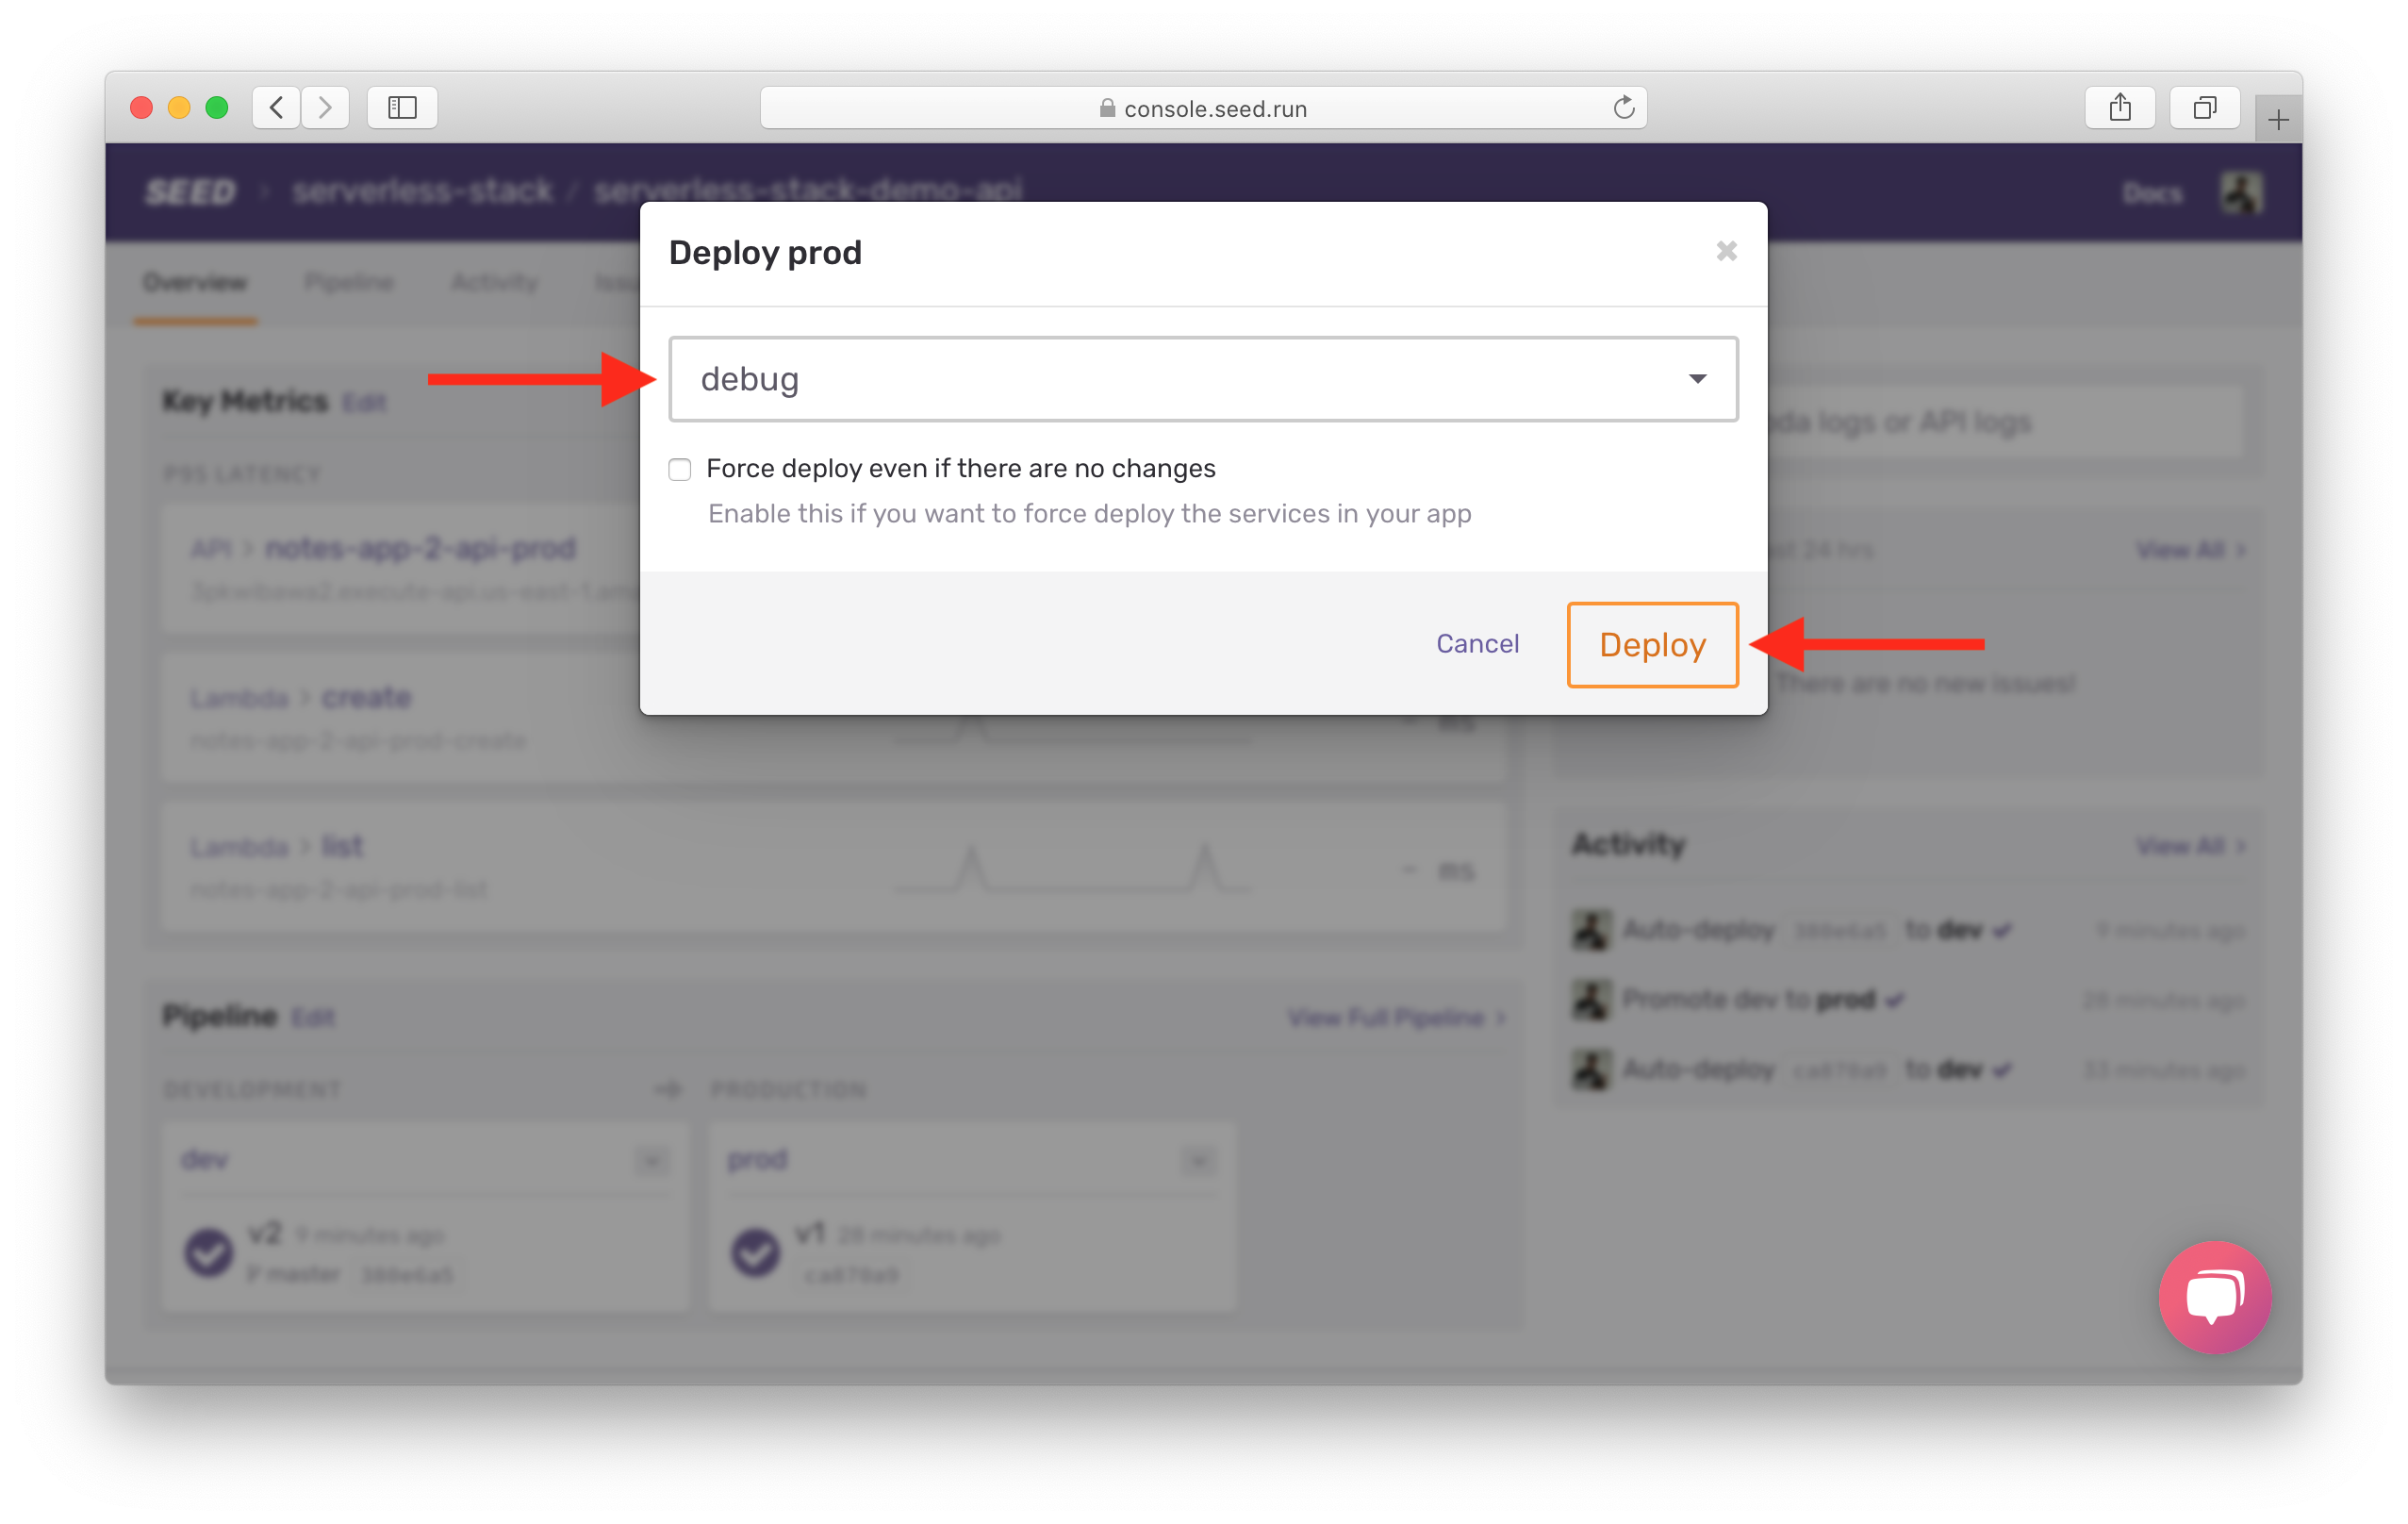
This will deploy our faulty code to production.
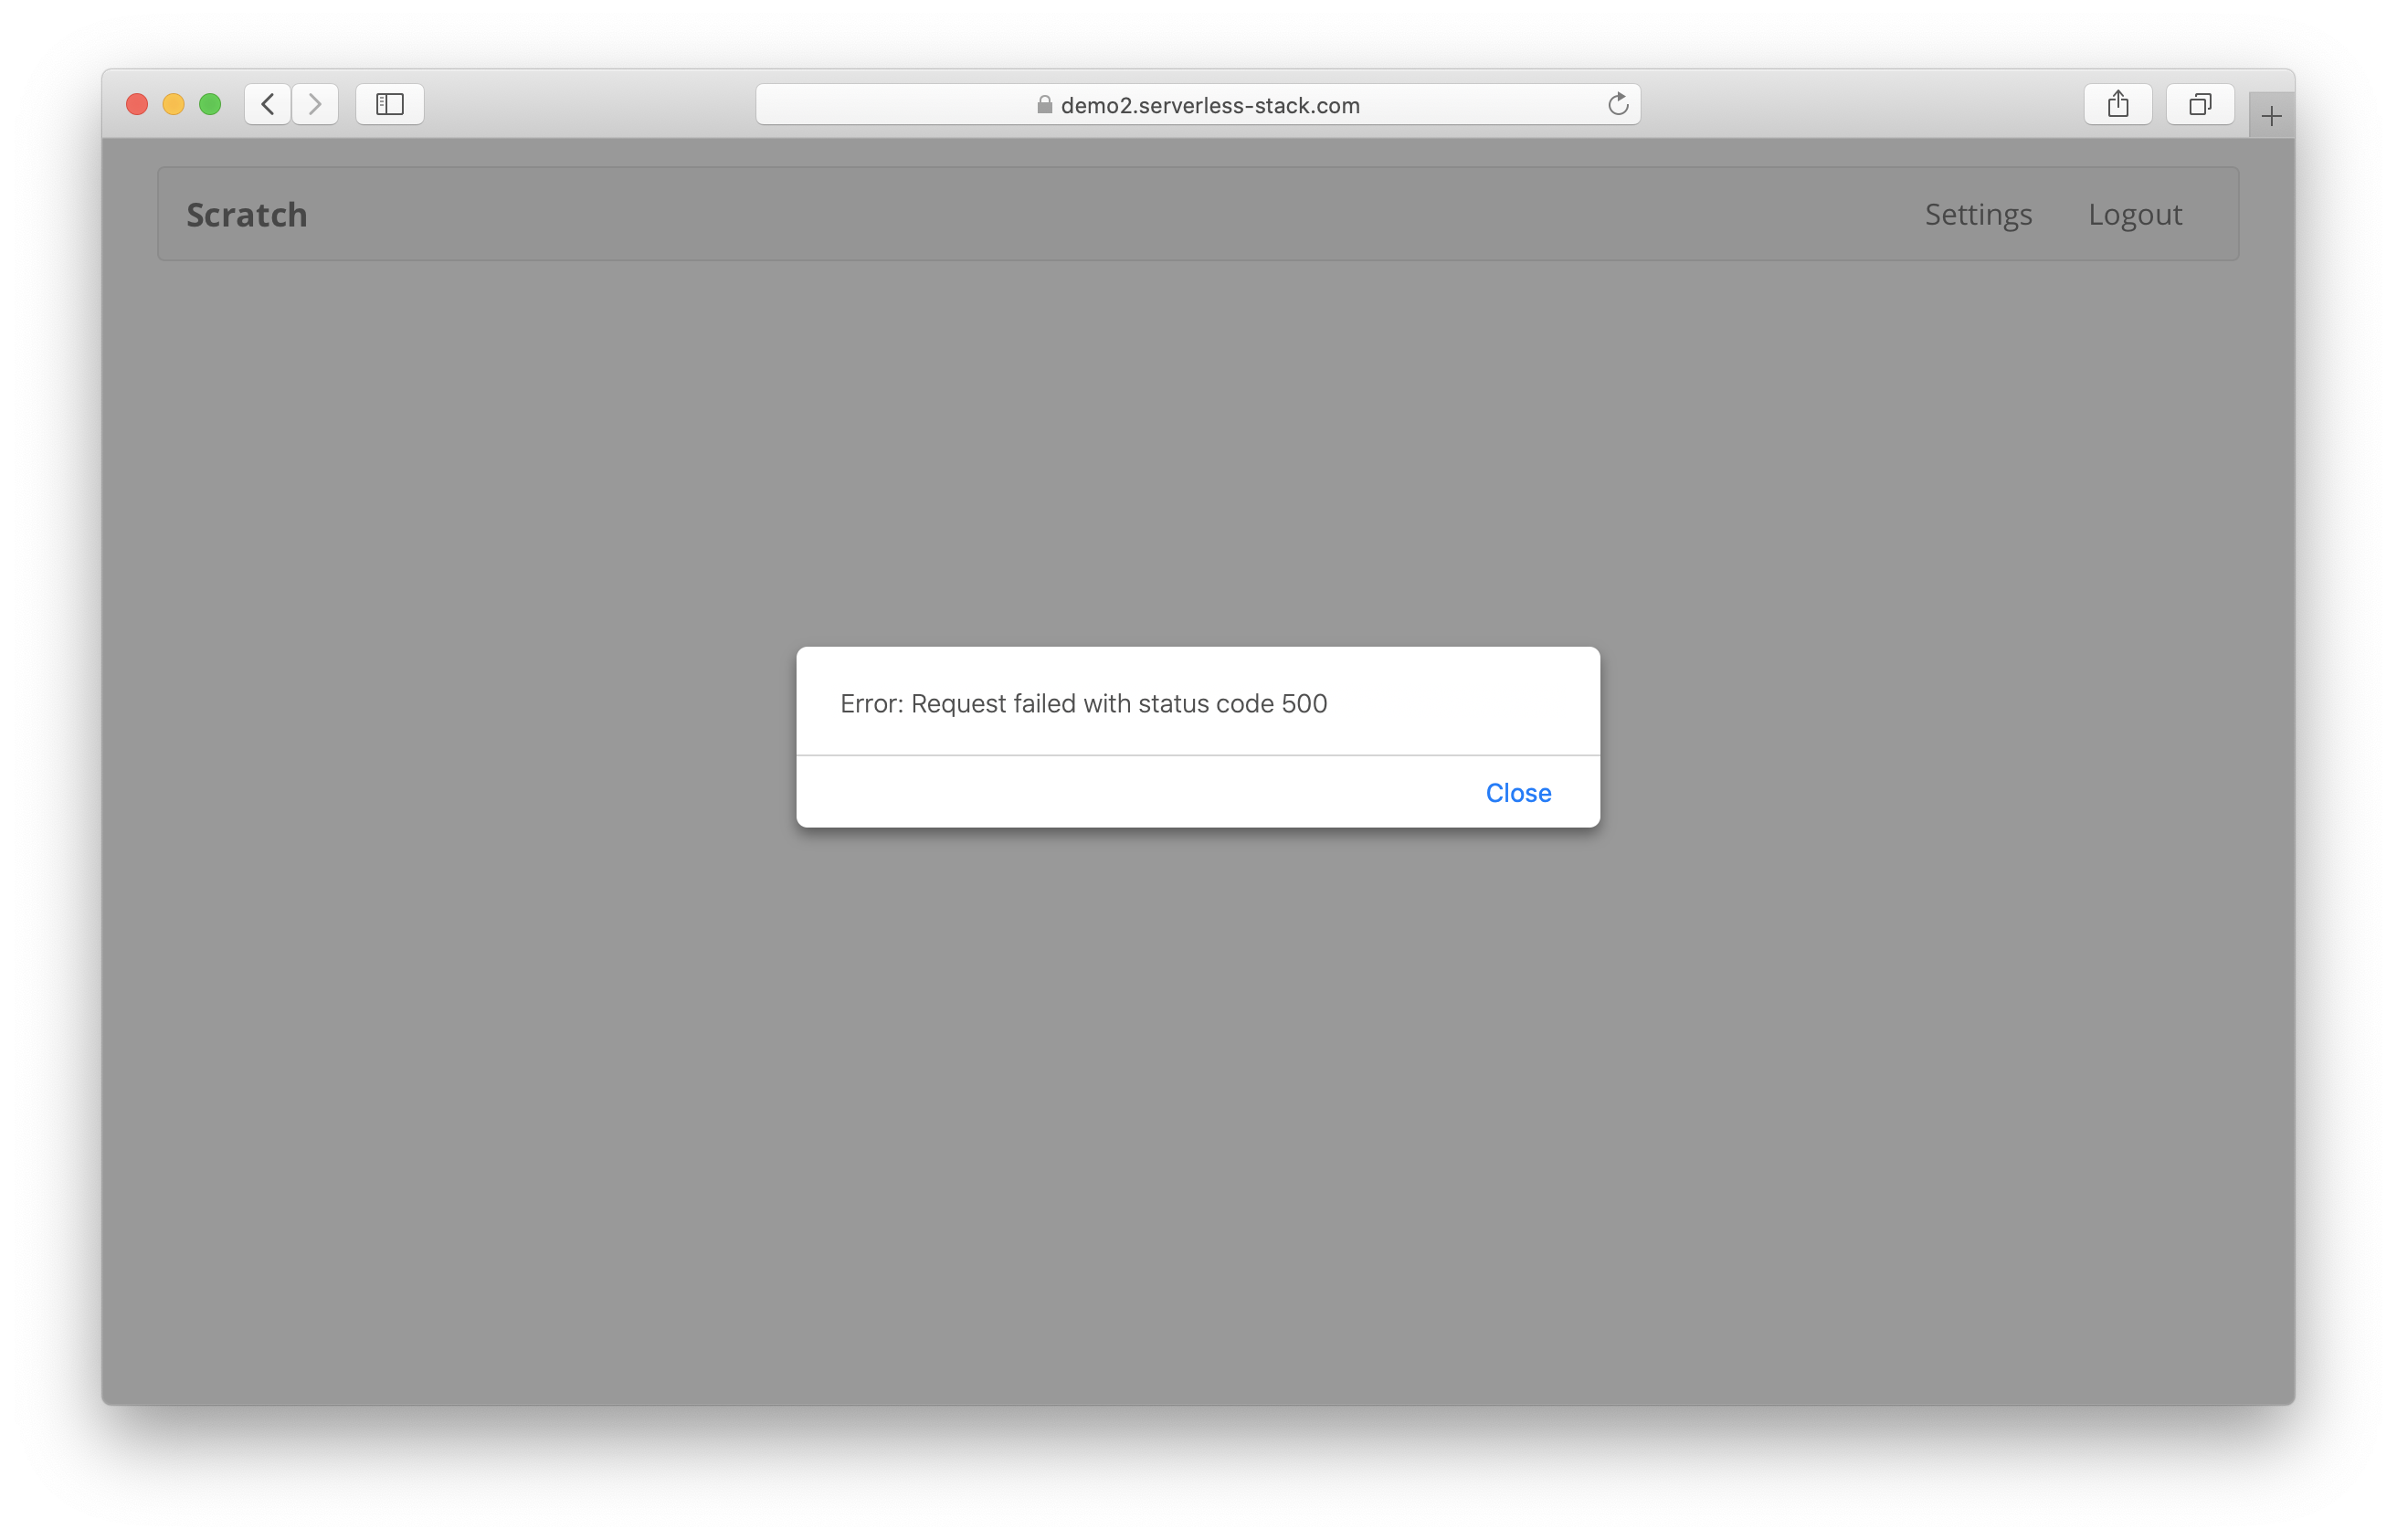
Head over on to your notes app, and select a note. You’ll notice the page fails to load with an error alert.
Debug Logic Errors
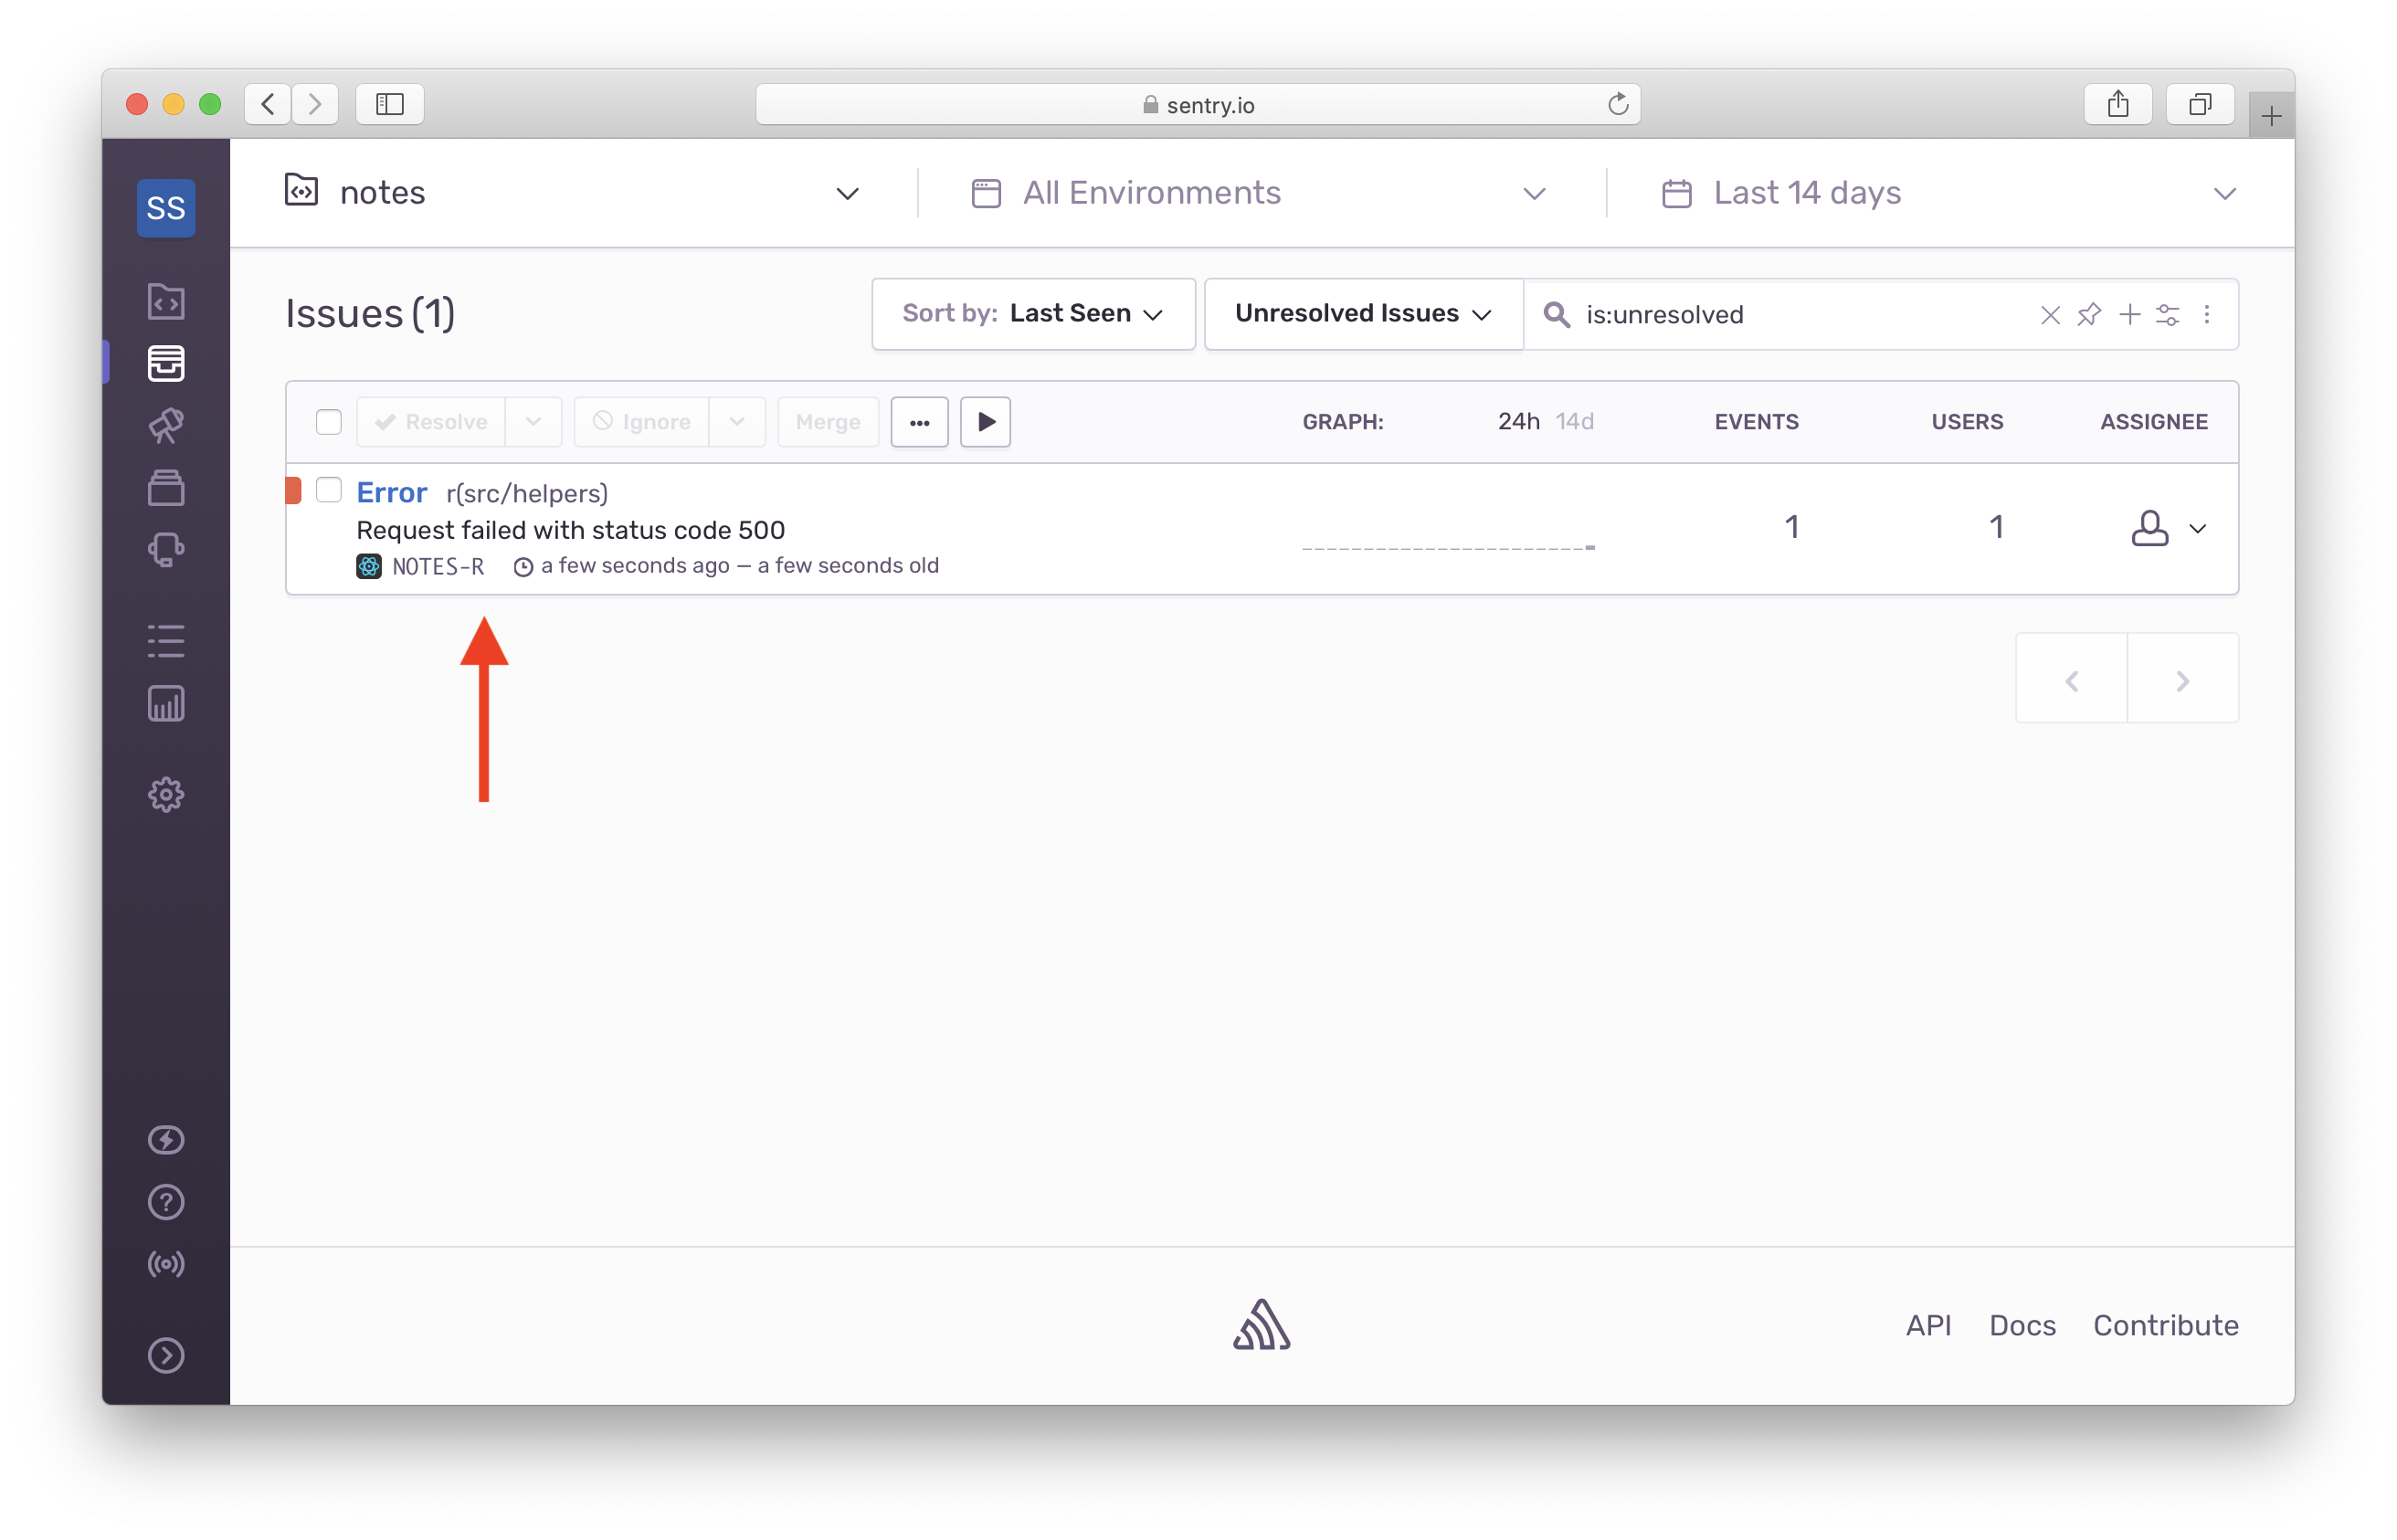
To start with, you should get an email from Sentry about this error. Go to Sentry and you should see the error showing at the top. Select the error.
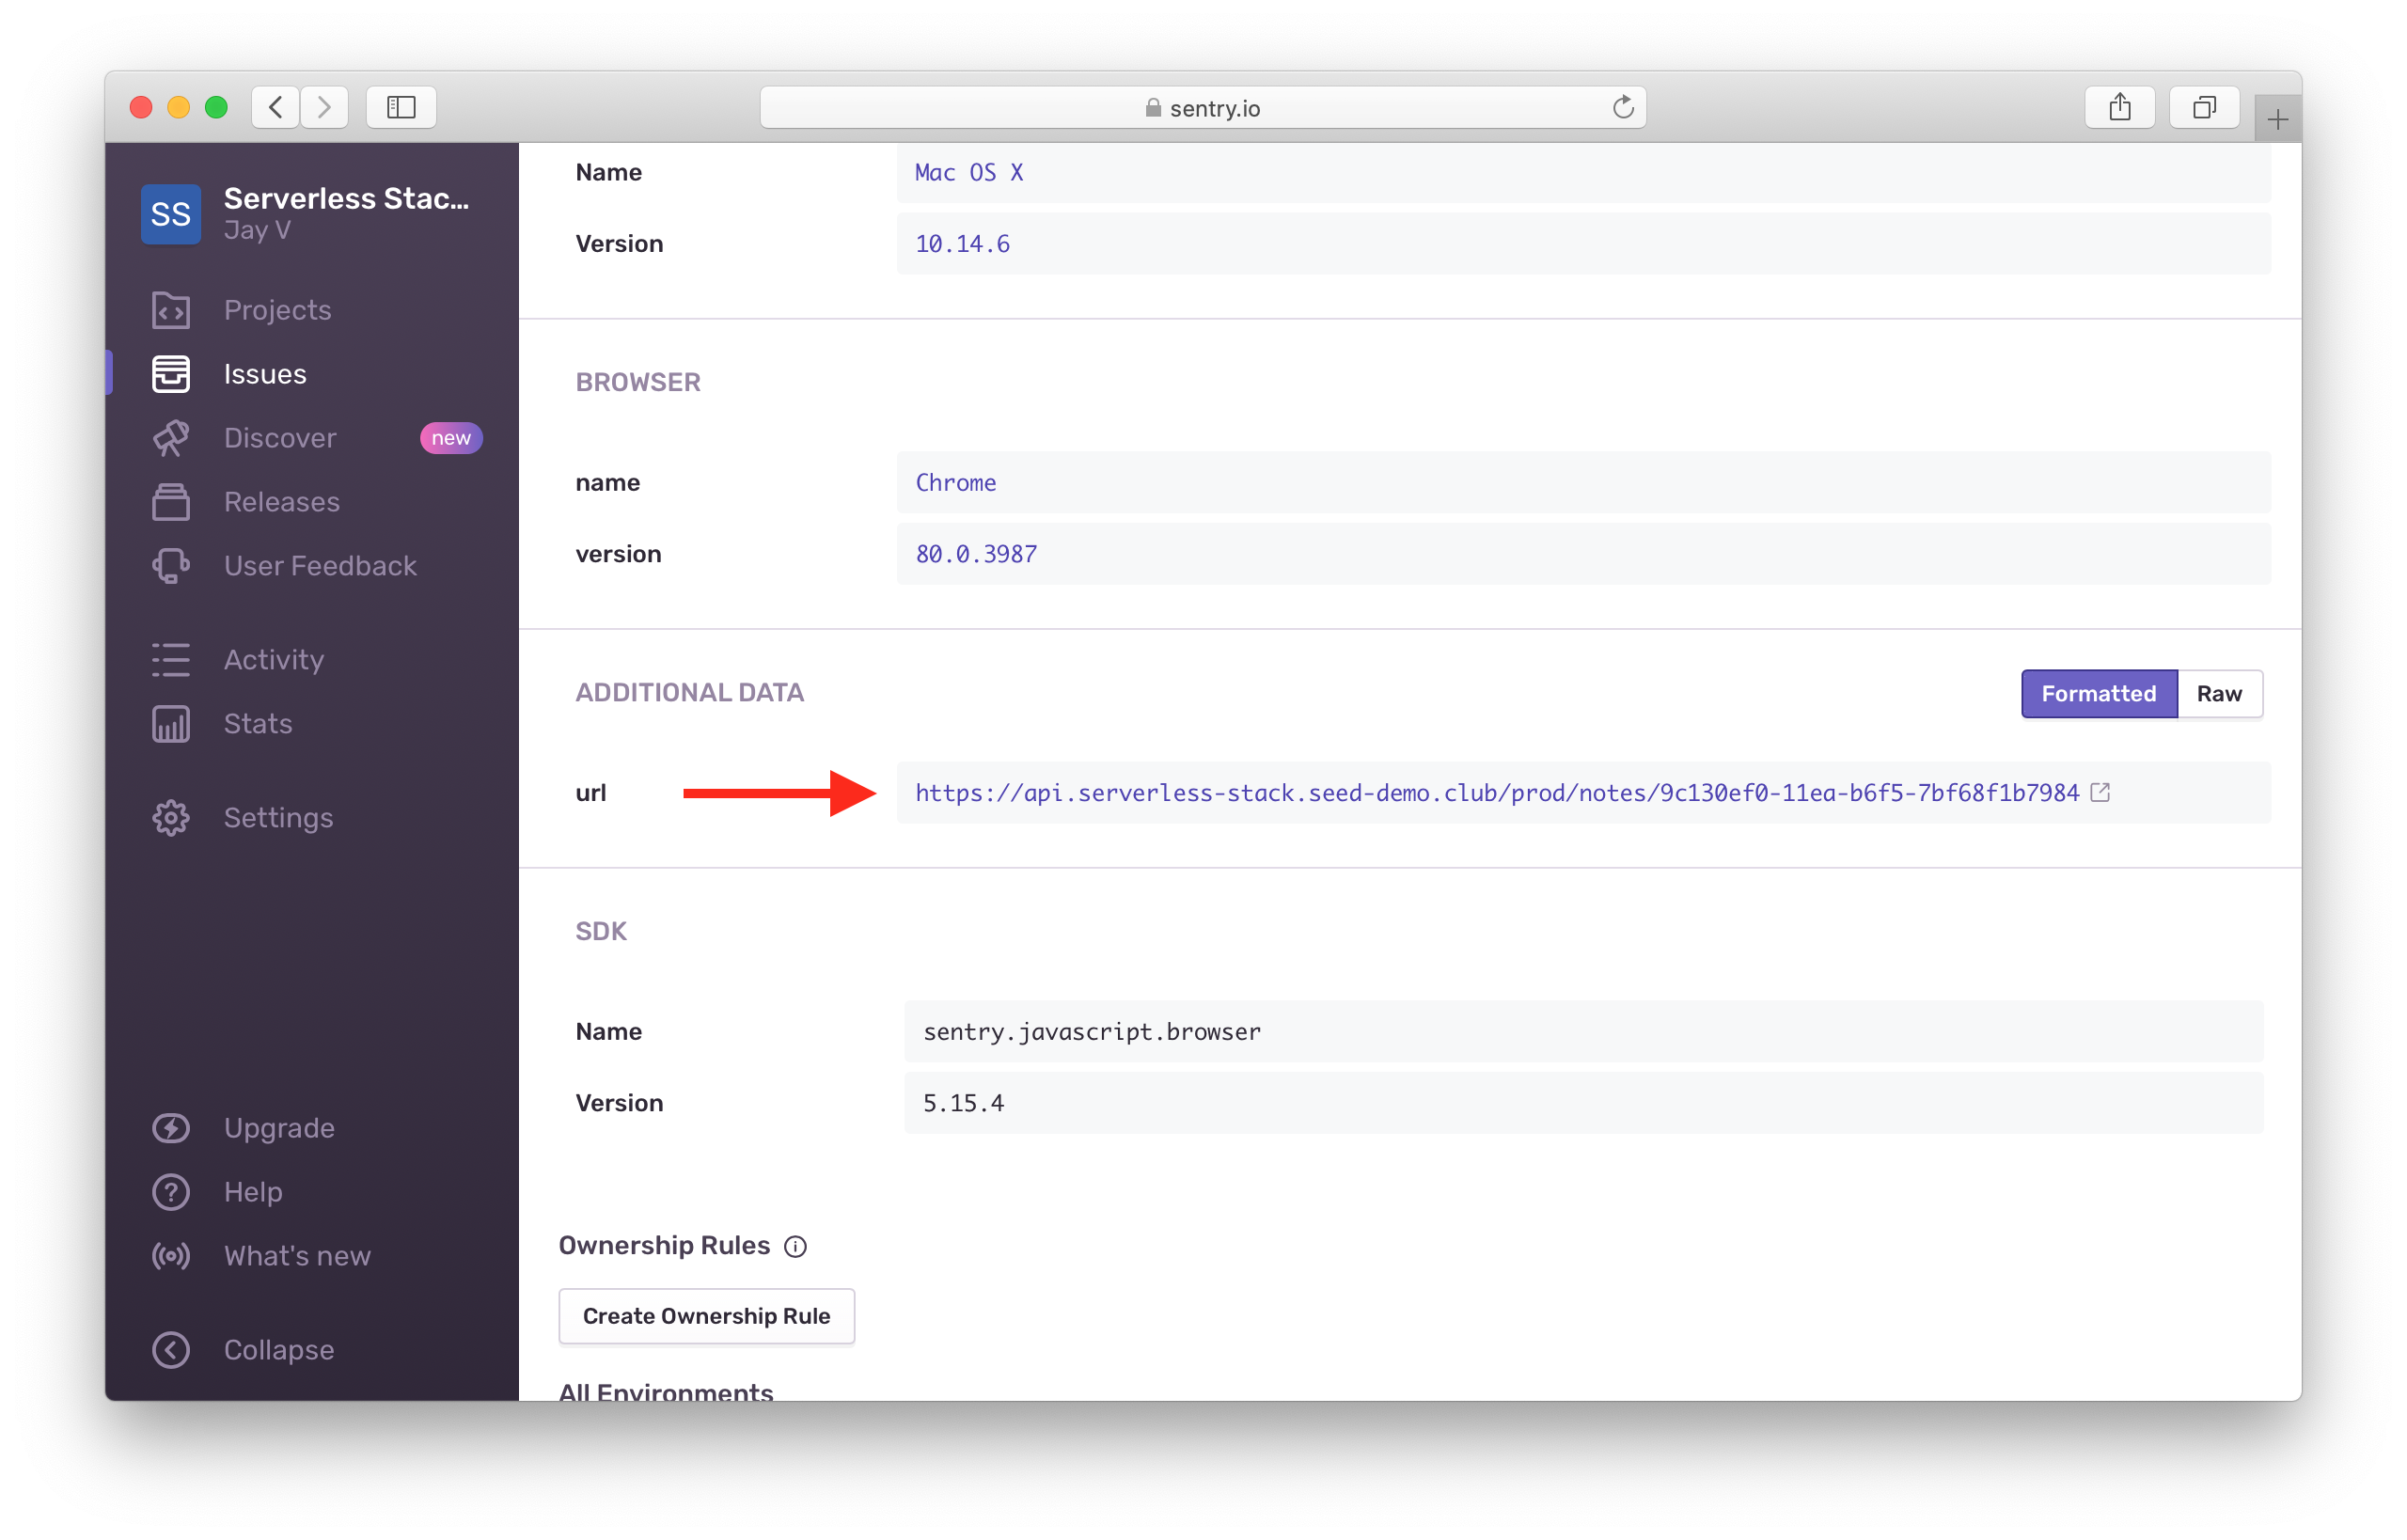
You’ll see that our frontend error handler is logging the API endpoint that failed.
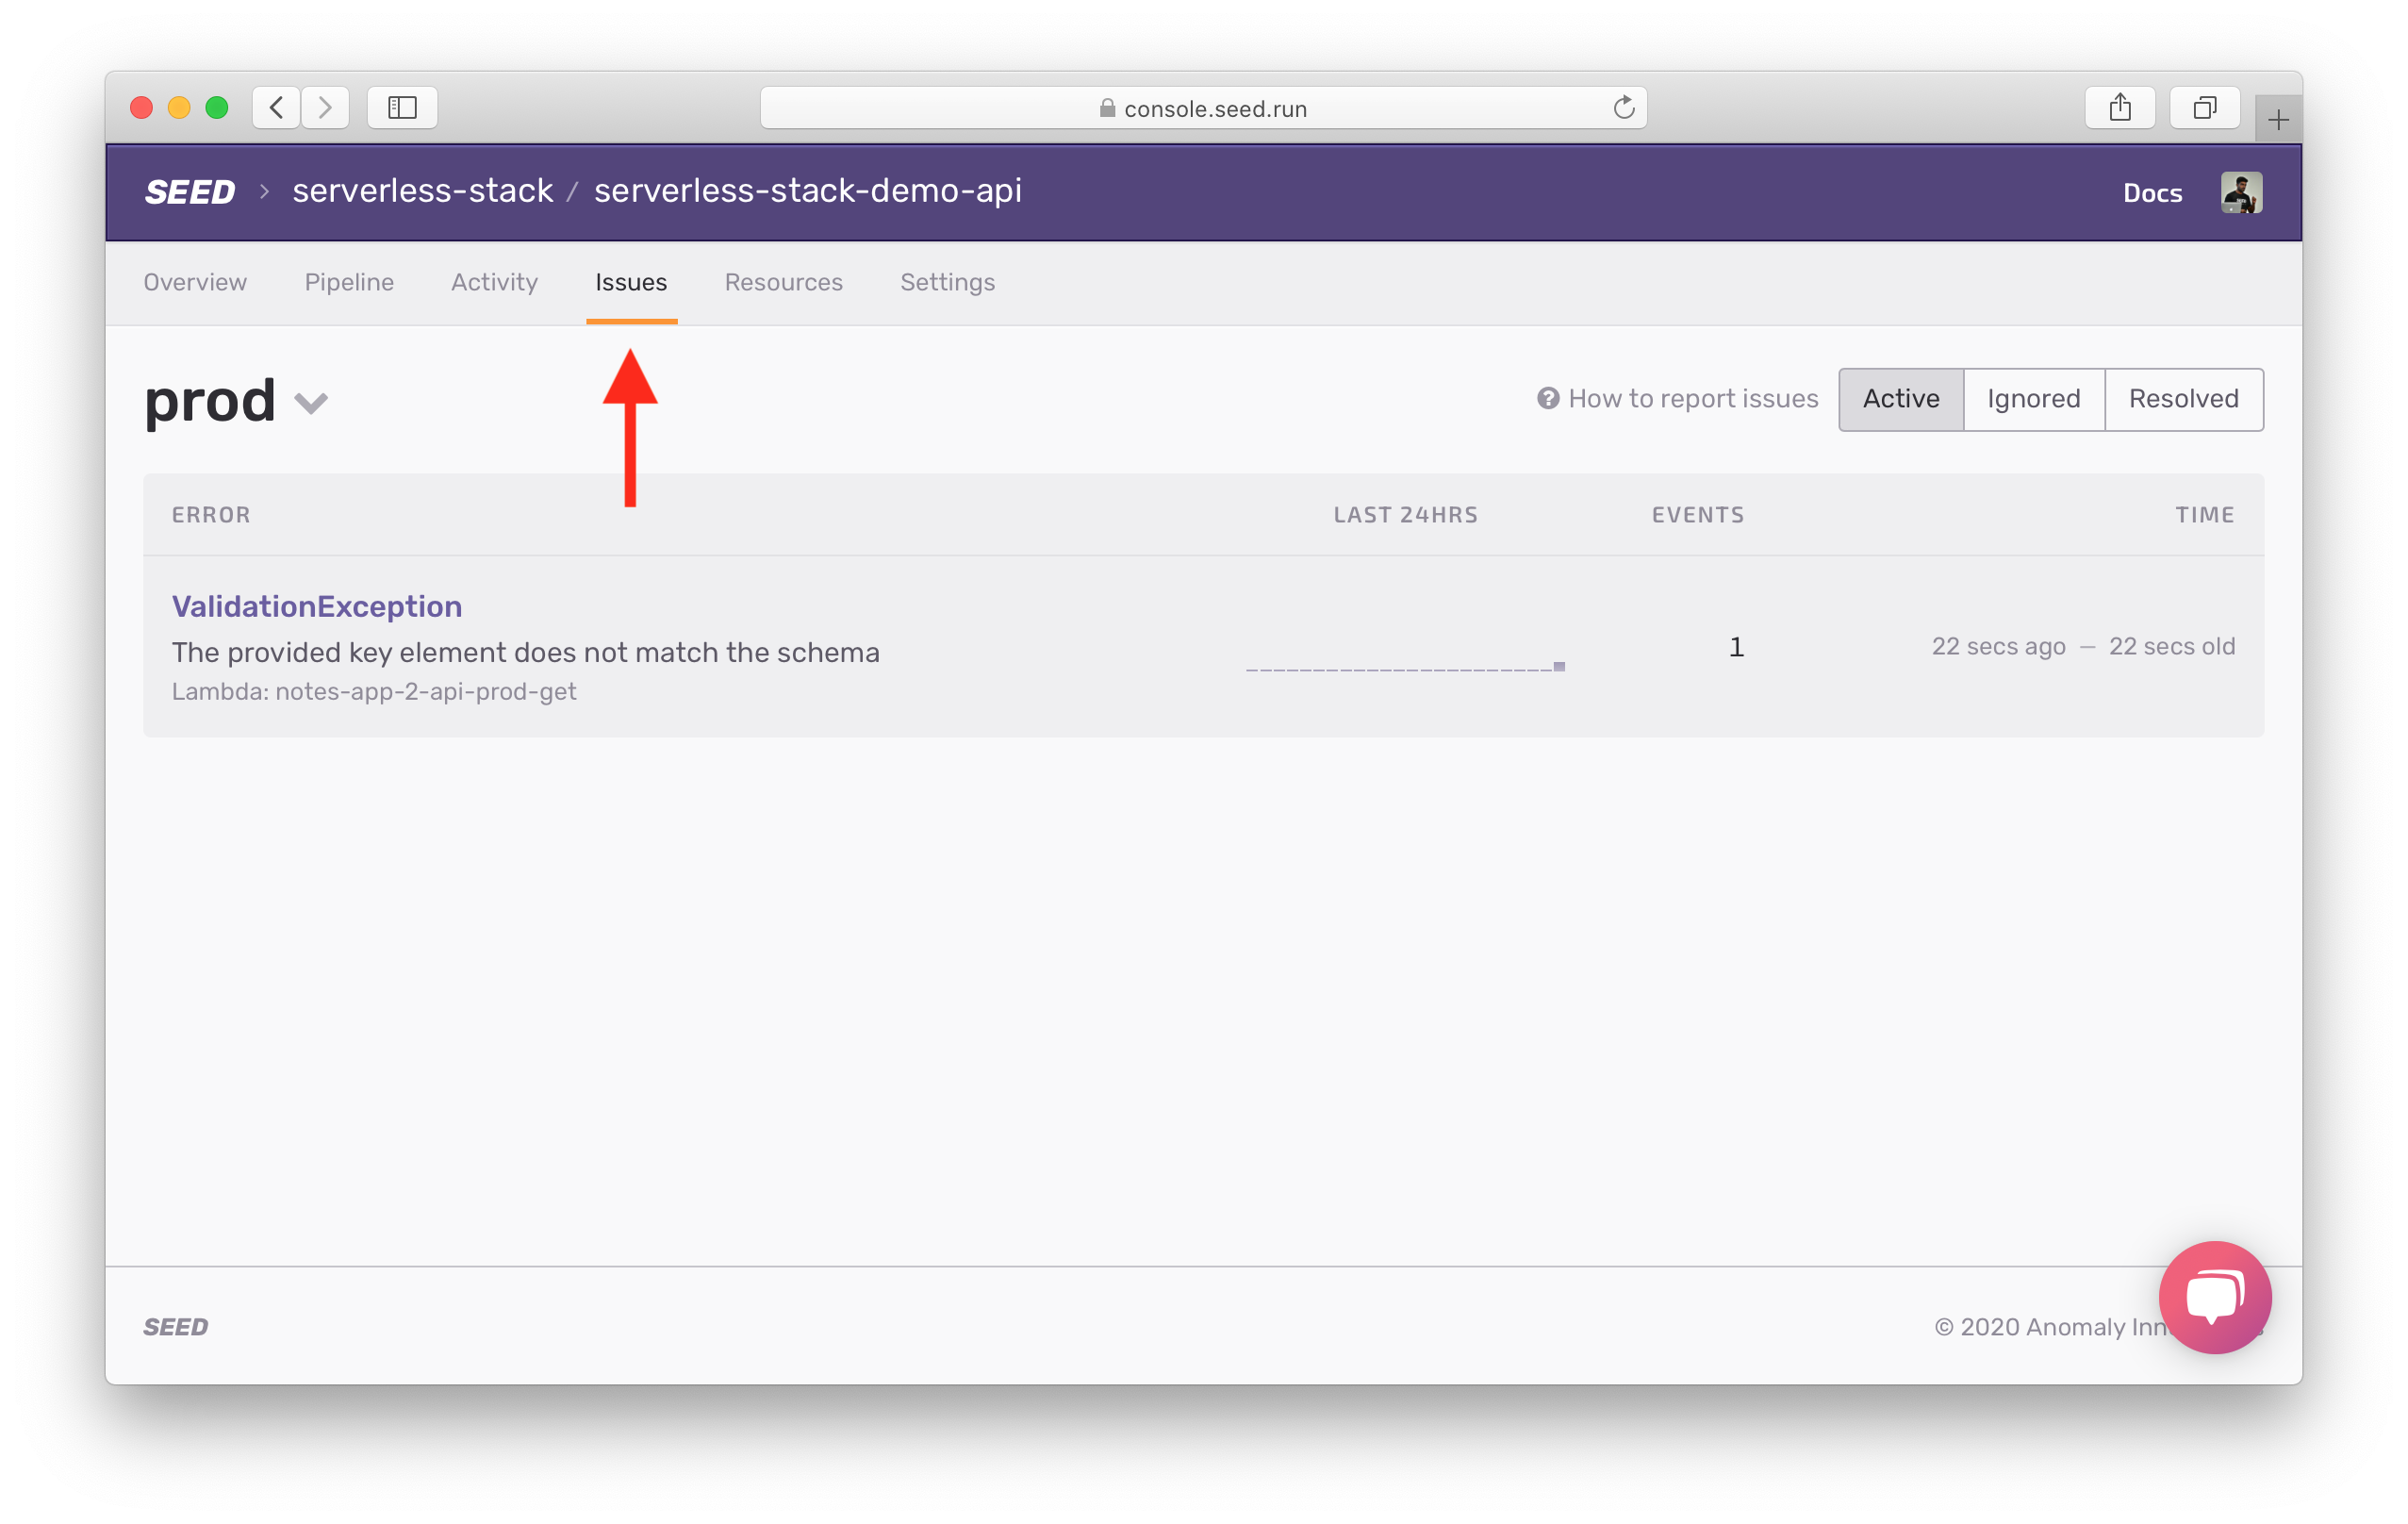
You’ll also get an email from Seed telling you that there was an error in your Lambda functions. If you click on the Issues tab you’ll see the error at the top.
And if you click on the error, you’ll see the error message and stack trace.
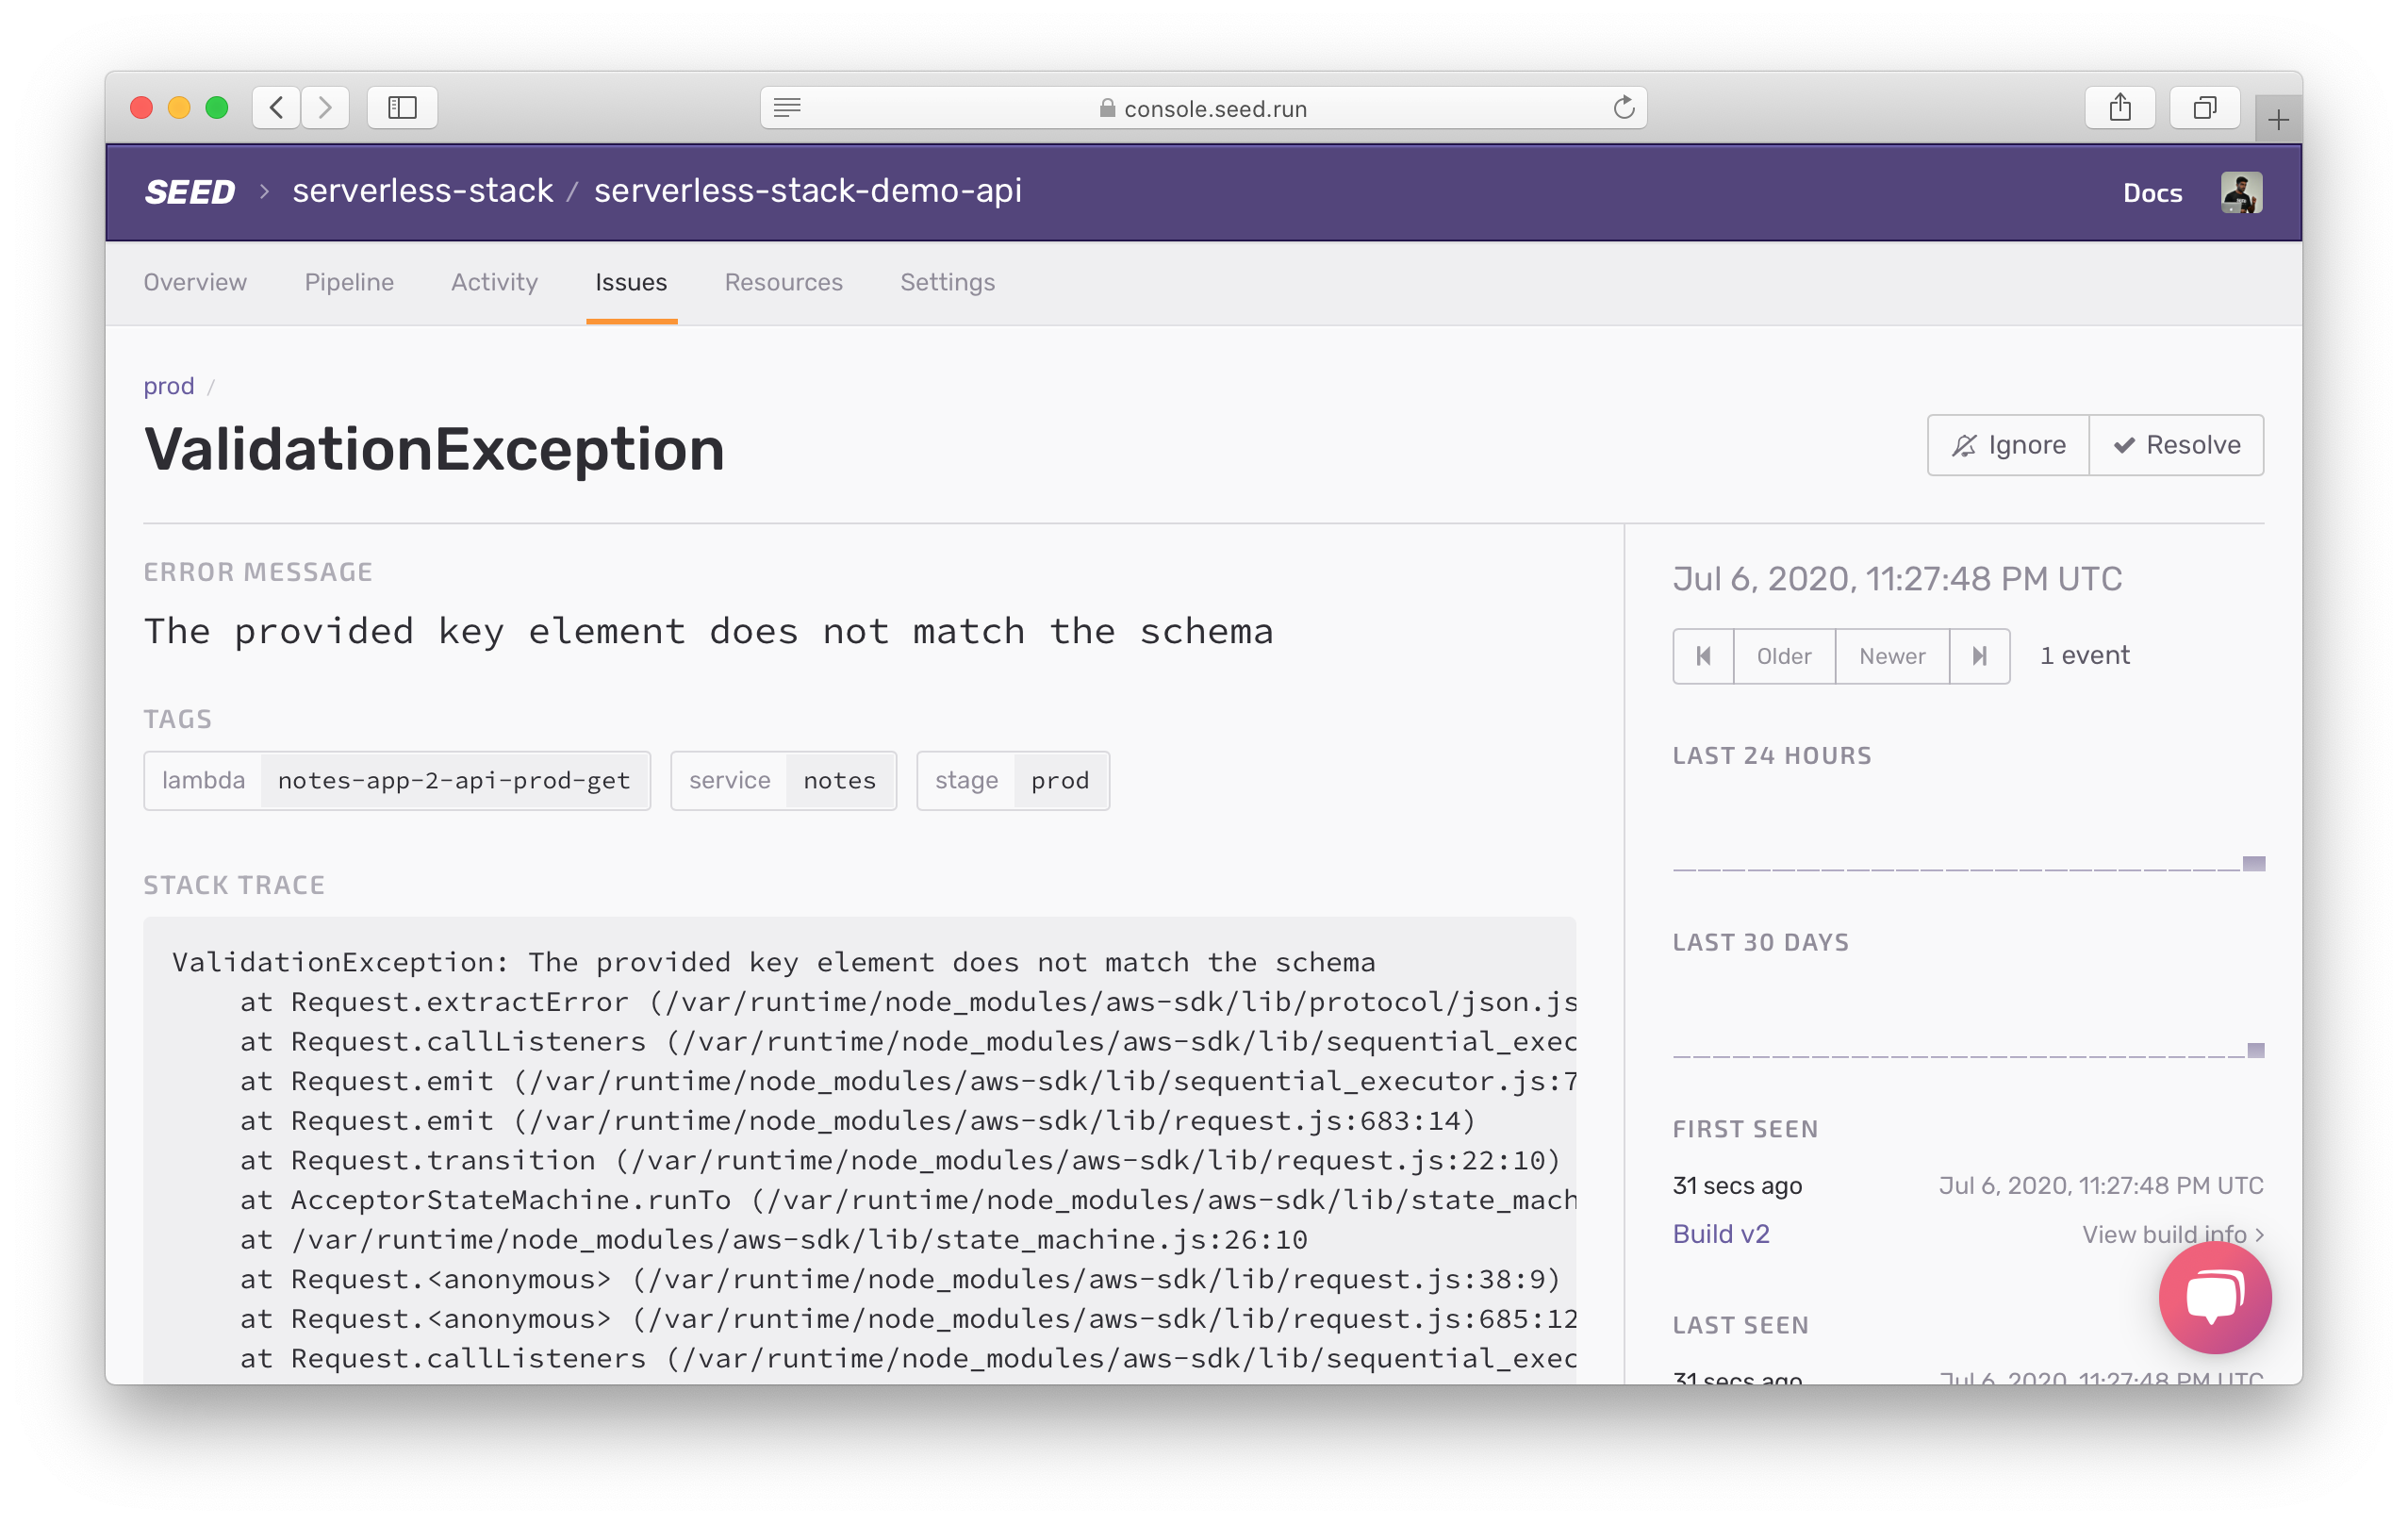
If you scroll down a bit further you’ll notice the entire request log. Including debug messages from the AWS SDK as it tries to call DynamoDB.
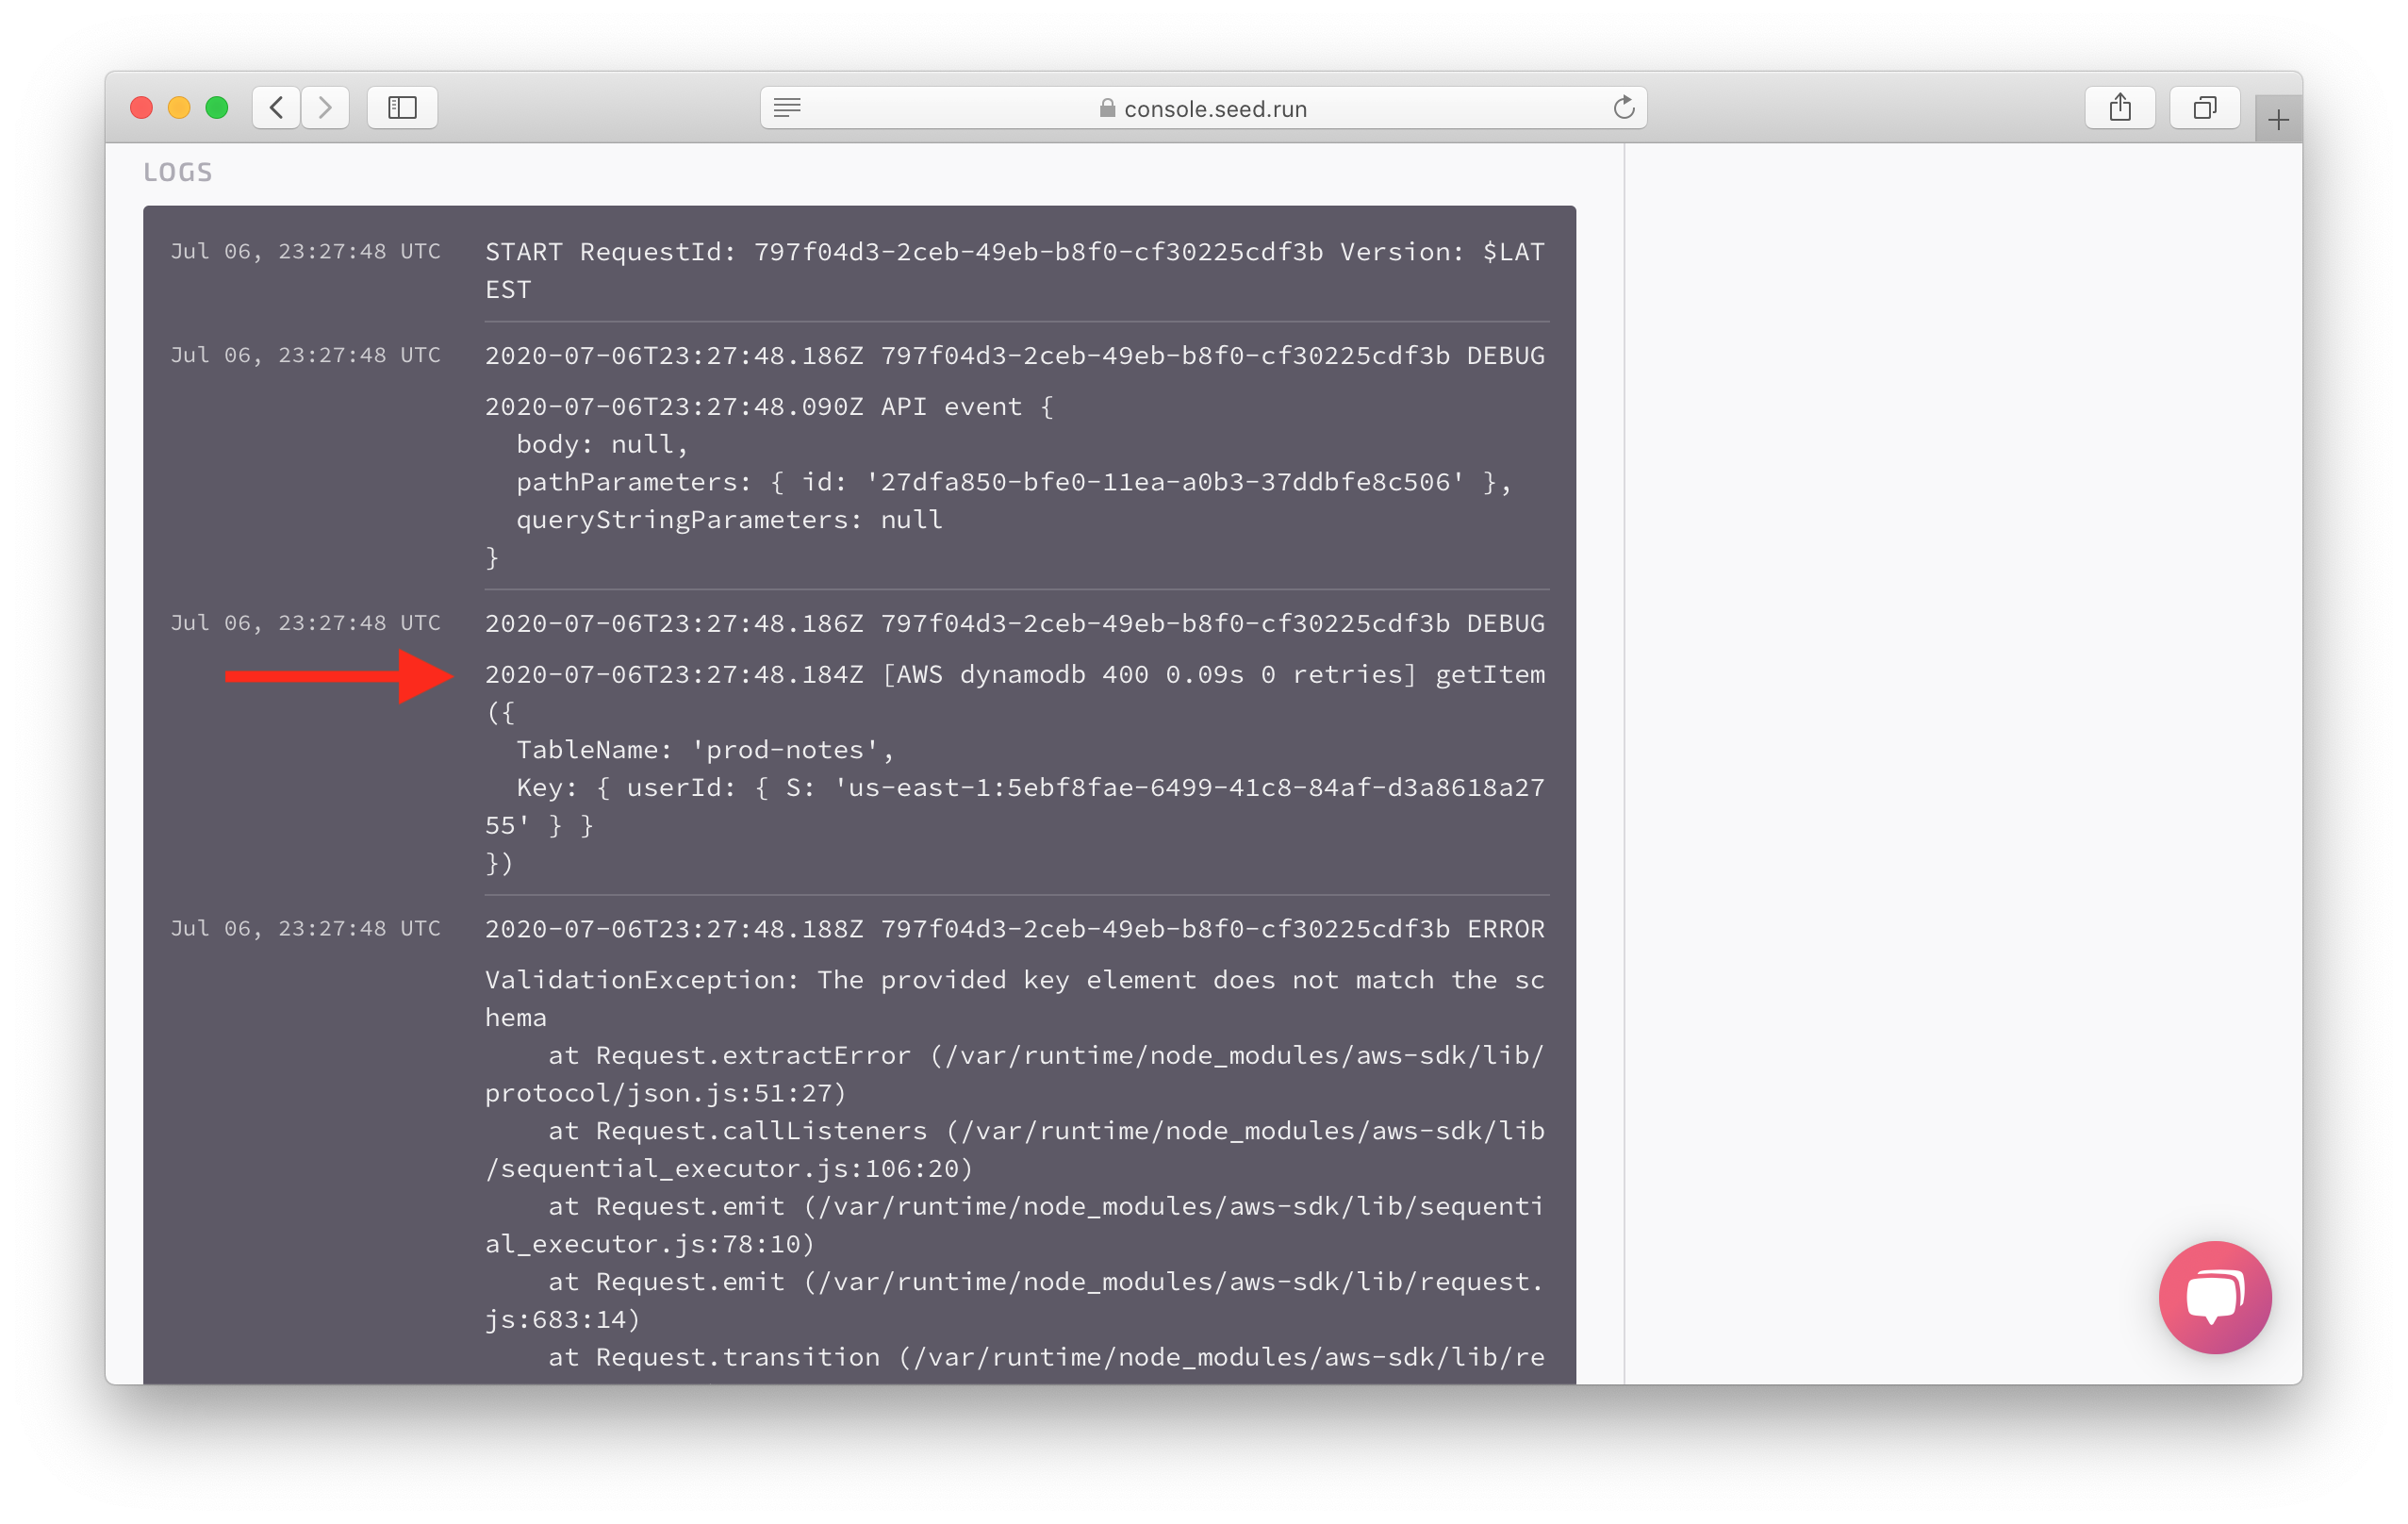
The message The provided key element does not match the schema, says that there is something wrong with the Key that we passed in. Our debug messages helped guide us to the source of the problem!
Next let’s look at how we can debug unexpected errors in our Lambda functions.
For help and discussion
Comments on this chapter