Setup Error Logging in Serverless
Now that we have our React app configured to report errors, let’s move on to our Serverless backend. Our React app is reporting API errors (and other unexpected errors) with the API endpoint that caused the error. We want to use that info to be able to debug on the backend and figure out what’s going on.
To do this, we’ll setup the error logging in our backend to catch:
- Errors in our code
- Errors while calling AWS services
- Unexpected errors like Lambda functions timing out or running out of memory
We are going to look at how to setup a debugging framework to catch the above errors, and have enough context for us to easily pinpoint and fix the issue. We’ll be using CloudWatch to write our logs, and we’ll be using the log viewer in Seed to view them.
Setup a Debug Lib
Let’s start by adding some code to help us with that.
 Create a
 services/notes/libs/debug-lib.js file and add the following to it.
import util from "util";
import AWS from "aws-sdk";

let logs;

// Log AWS SDK calls
AWS.config.logger = { log: debug };

export default function debug() {
  logs.push({
    date: new Date(),
    string: util.format.apply(null, arguments),
  });
}

export function init(event, context) {
  logs = [];

  // Log API event
  debug("API event", {
    body: event.body,
    pathParameters: event.pathParameters,
    queryStringParameters: event.queryStringParameters,
  });
}

export function flush(e) {
  logs.forEach(({ date, string }) => console.debug(date, string));
  console.error(e);
}
We are doing a few things of note in this simple helper.
-
Enable AWS SDK logging
We start by enabling logging for the AWS SDK. We do so by running
AWS.config.logger = { log: debug }. This is telling the AWS SDK to log using our logger, thedebug()method (we’ll look at this below). So when you make a call to an AWS service, ie. a query call to the DynamoDB tabledev-notes, this will log:[AWS dynamodb 200 0.296s 0 retries] query({ TableName: 'dev-notes', KeyConditionExpression: 'userId = :userId', ExpressionAttributeValues: { ':userId': { S: 'USER-SUB-1234' } } })Note, we only want to log this info when there is an error. We’ll look at how we accomplish this below.
-
Log API request info
We initialize our debugger by calling
init(). We log the API request info, including the path parameters, query string parameters, and request body. We do so using our internaldebug()method. -
Log only on error
We log messages using our special
debug()method. Debug messages logged using this method only get printed out when we call theflush()method. This allows us to log very detailed contextual information about what was being done leading up to the error. We can log:- Arguments and return values for function calls.
- And, request/response data for HTTP requests made.
We only want to print out debug messages to the console when we run into an error. This helps us reduce clutter in the case of successful requests. And, keeps our CloudWatch costs low!
To do this, we store the log info (when calling
debug()) in memory inside thelogsarray. And when we callflush()(in the case of an error), weconsole.debug()all those stored log messages.
So in our Lambda function code, if we want to log some debug information that only gets printed out if we have an error, we’ll do the following:
import debug from "../libs/debug-lib";

debug('This stores the message and prints to CloudWatch if Lambda function later throws an exception');
In contrast, if we always want to log to CloudWatch, we’ll:
console.log('This prints a message in CloudWatch prefixed with INFO');
console.warn('This prints a message in CloudWatch prefixed with WARN');
console.error('This prints a message in CloudWatch prefixed with ERROR');
Now let’s use the debug library in our Lambda functions.
Setup Handler Lib
You’ll recall that all our Lambda functions are wrapped using a handler() method. We use this to format what our Lambda functions return as their HTTP response. It also, handles any errors that our Lambda functions throws.
We’ll use the debug lib that we added above to improve our error handling.
Replace our services/notes/libs/handler-lib.js with the following.
import * as debug from "./debug-lib";

export default function handler(lambda) {
  return async function (event, context) {
    let body, statusCode;

    // Start debugger
    debug.init(event, context);

    try {
      // Run the Lambda
      body = await lambda(event, context);
      statusCode = 200;
    } catch (e) {
      // Print debug messages
      debug.flush(e);

      body = { error: e.message };
      statusCode = 500;
    }

    // Return HTTP response
    return {
      statusCode,
      body: JSON.stringify(body),
      headers: {
        "Access-Control-Allow-Origin": "*",
        "Access-Control-Allow-Credentials": true,
      },
    };
  };
}
This should be fairly straightforward:
- We initialize our debugger by calling
debug.init(). - We run our Lambda function.
- We format the success response.
- In the case of an error, we first write out our debug logs by calling
debug.flush(e). Whereeis the error that caused our Lambda function to fail. - We format and return our HTTP response.
Using the Error Handler
You might recall the way we are currently using the above error handler in our Lambda functions.
import handler from "./libs/handler-lib";

export const main = handler((event, context) => {
  // Do some work
  const a = 1 + 1;
  // Return a result
  return { result: a };
});
We wrap all of our Lambda functions using the error handler.
Note that, the handler-lib.js needs to be imported before we import anything else. This is because the debug-lib.js that it imports needs to initialize AWS SDK logging before it’s used anywhere else.
Commit the Code
Let’s push our changes
Let’s commit the code we have so far.
$ git add .
$ git commit -m "Adding error logging"
$ git push
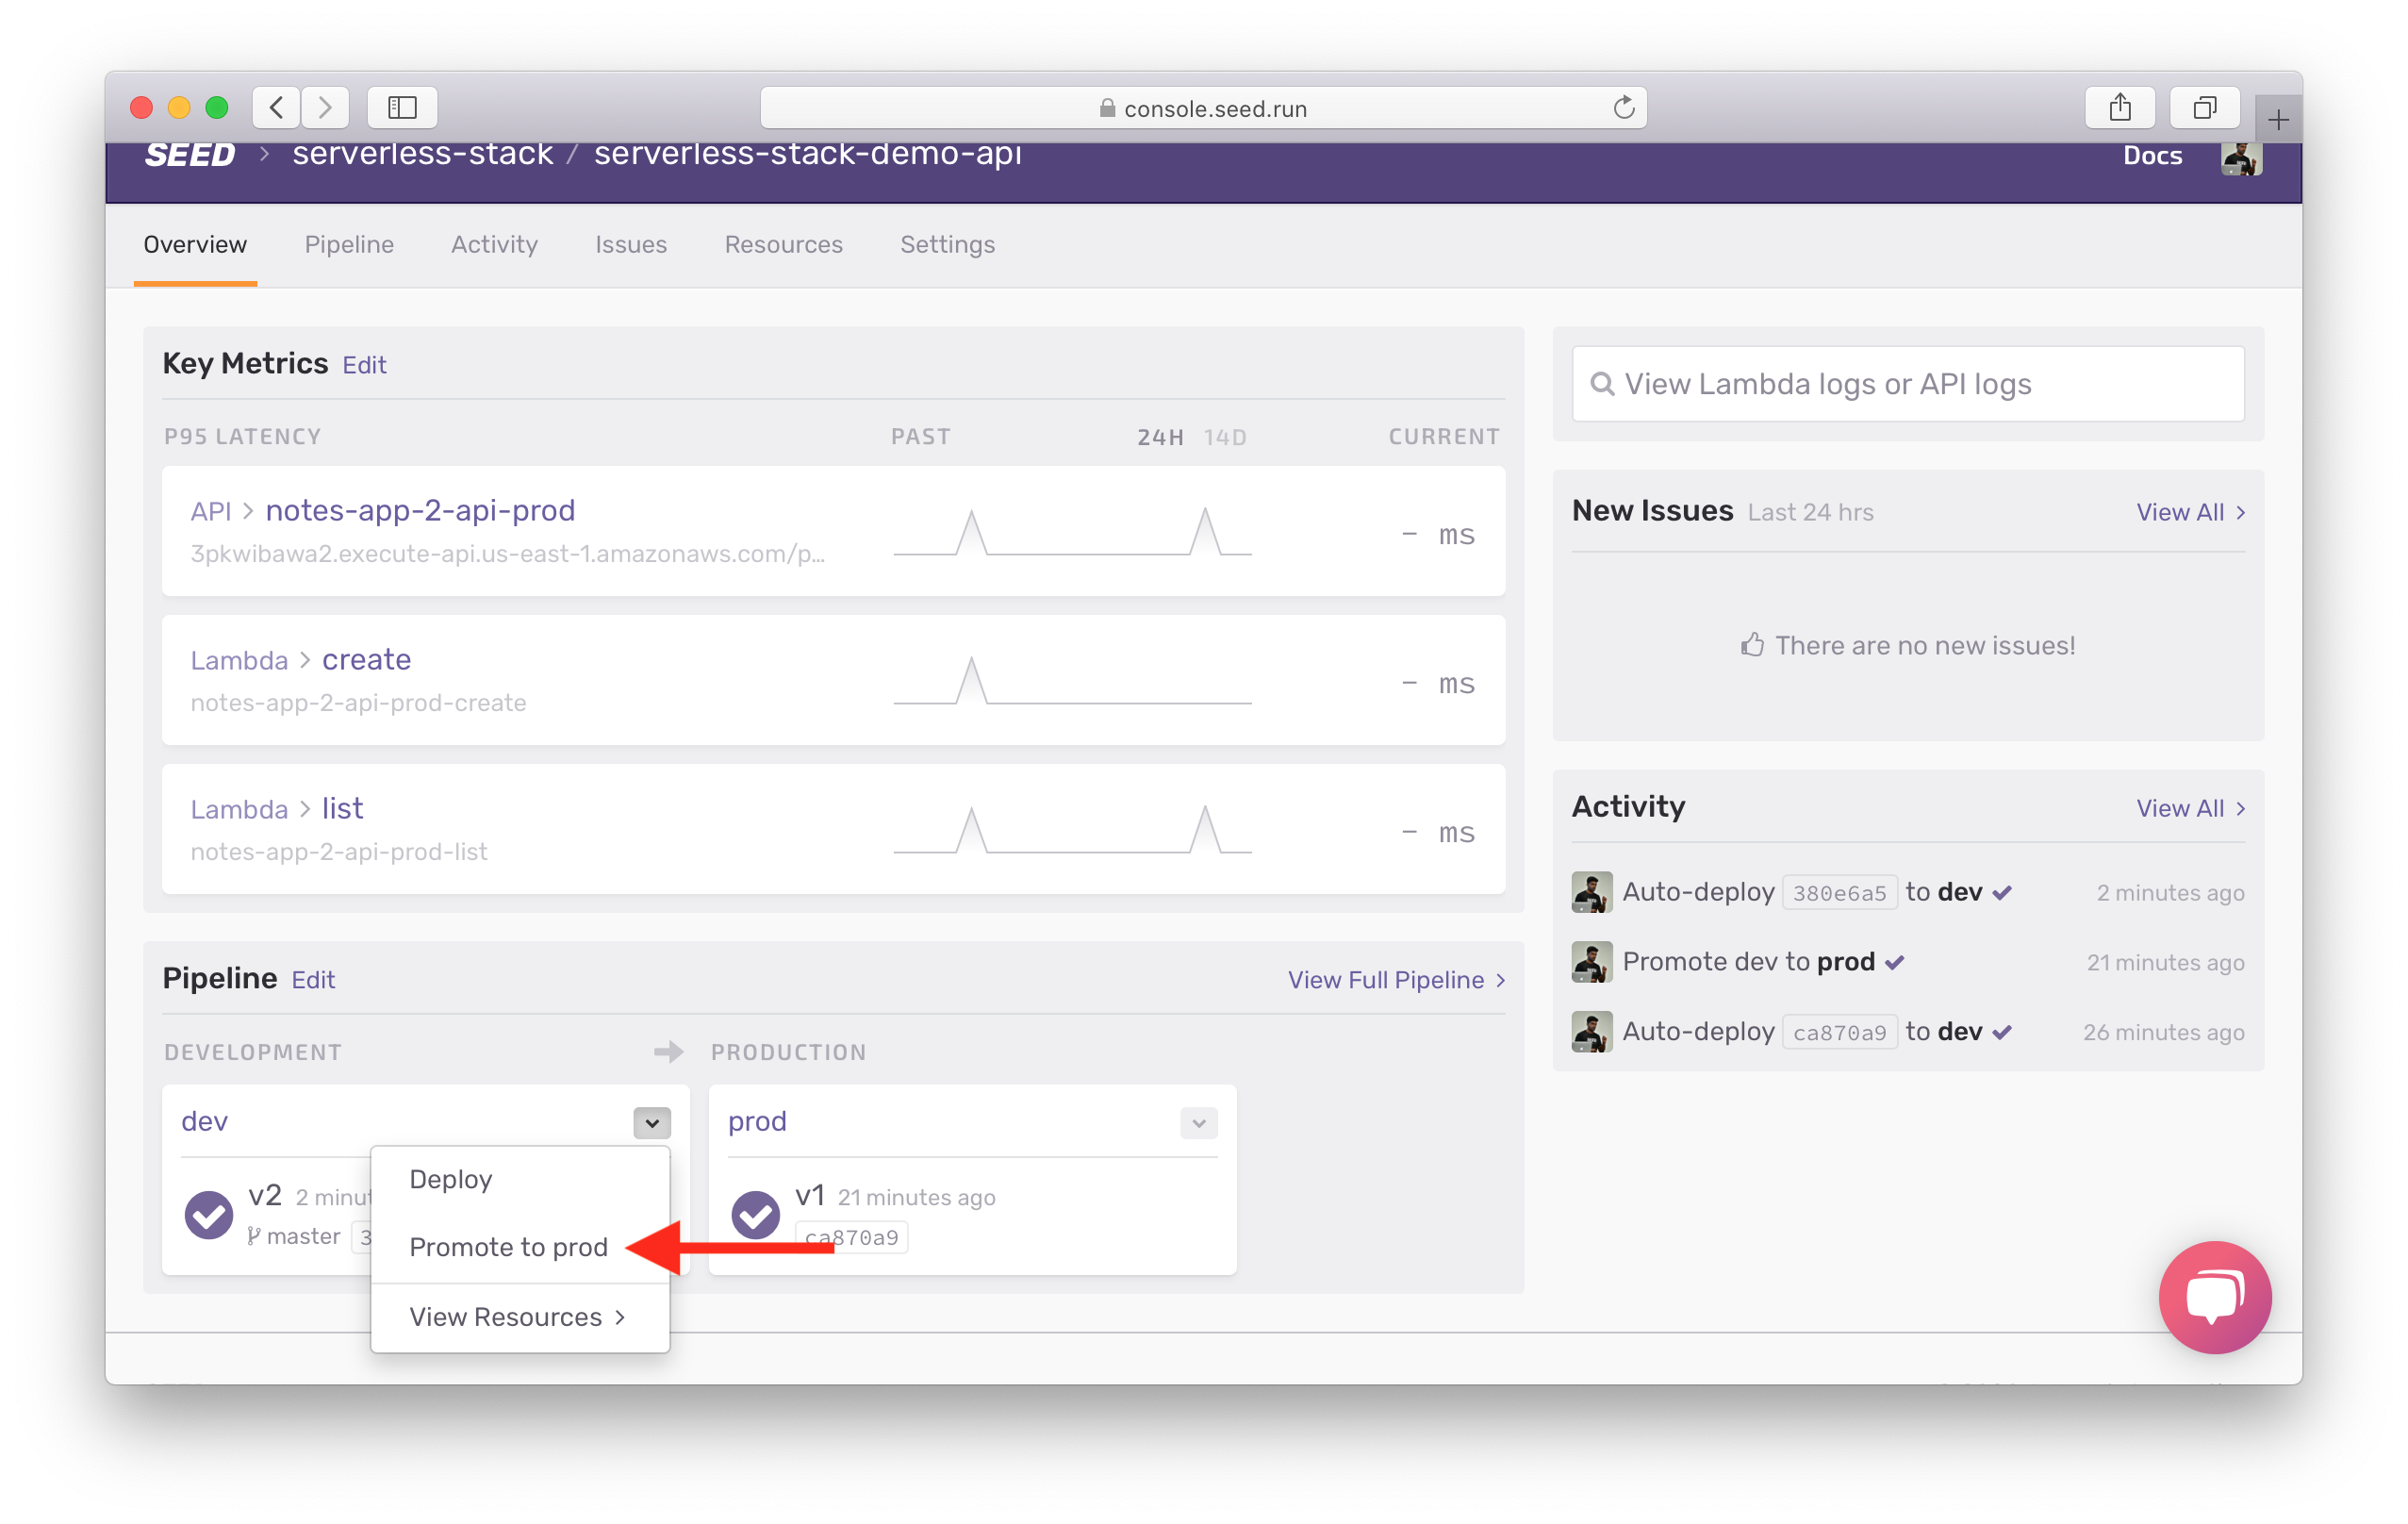
And promote the changes to production.
Head over to the Seed console and hit Promote to prod once your changes are deployed to dev.
Enable Access Logs
The combination of our new error handler and Lambda logs will help us catch most of the errors. However, we can run into errors that don’t make it to our Lambda functions. To debug these errors we’ll need to look at the API Gateway logs. So let’s go head and enable access logs for our API.
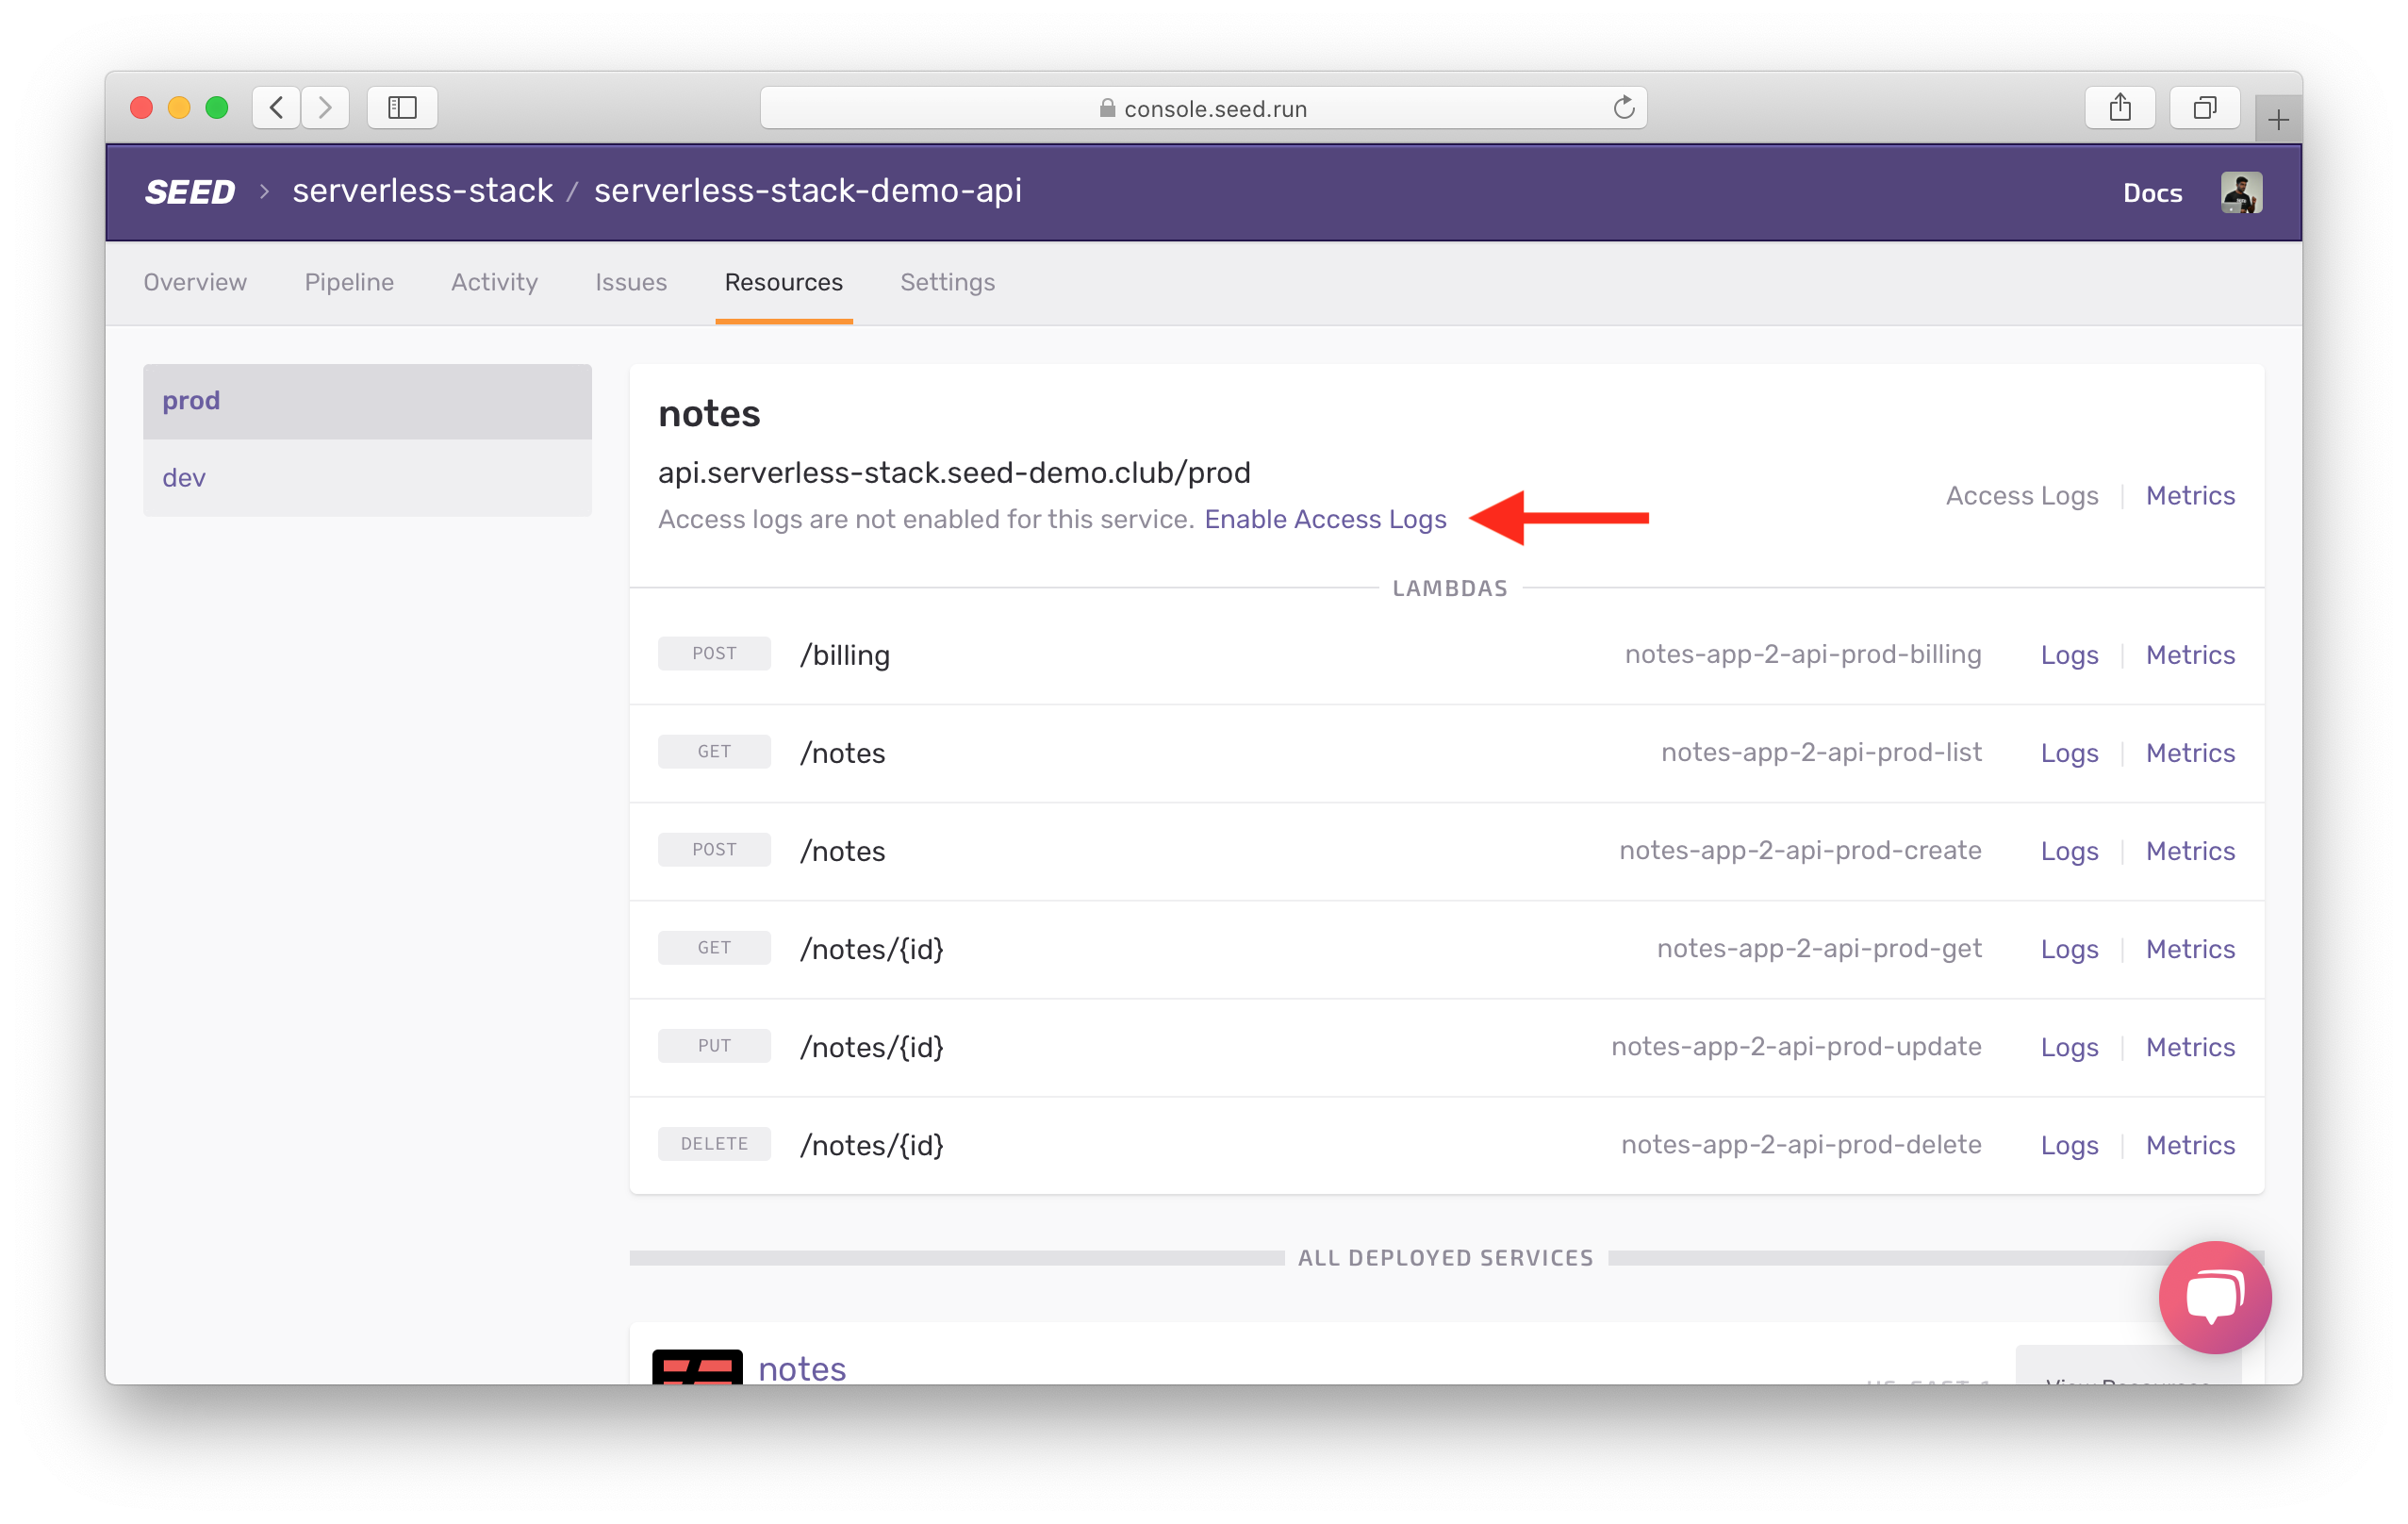
From the dashboard for your app on Seed, select the Resources tab.
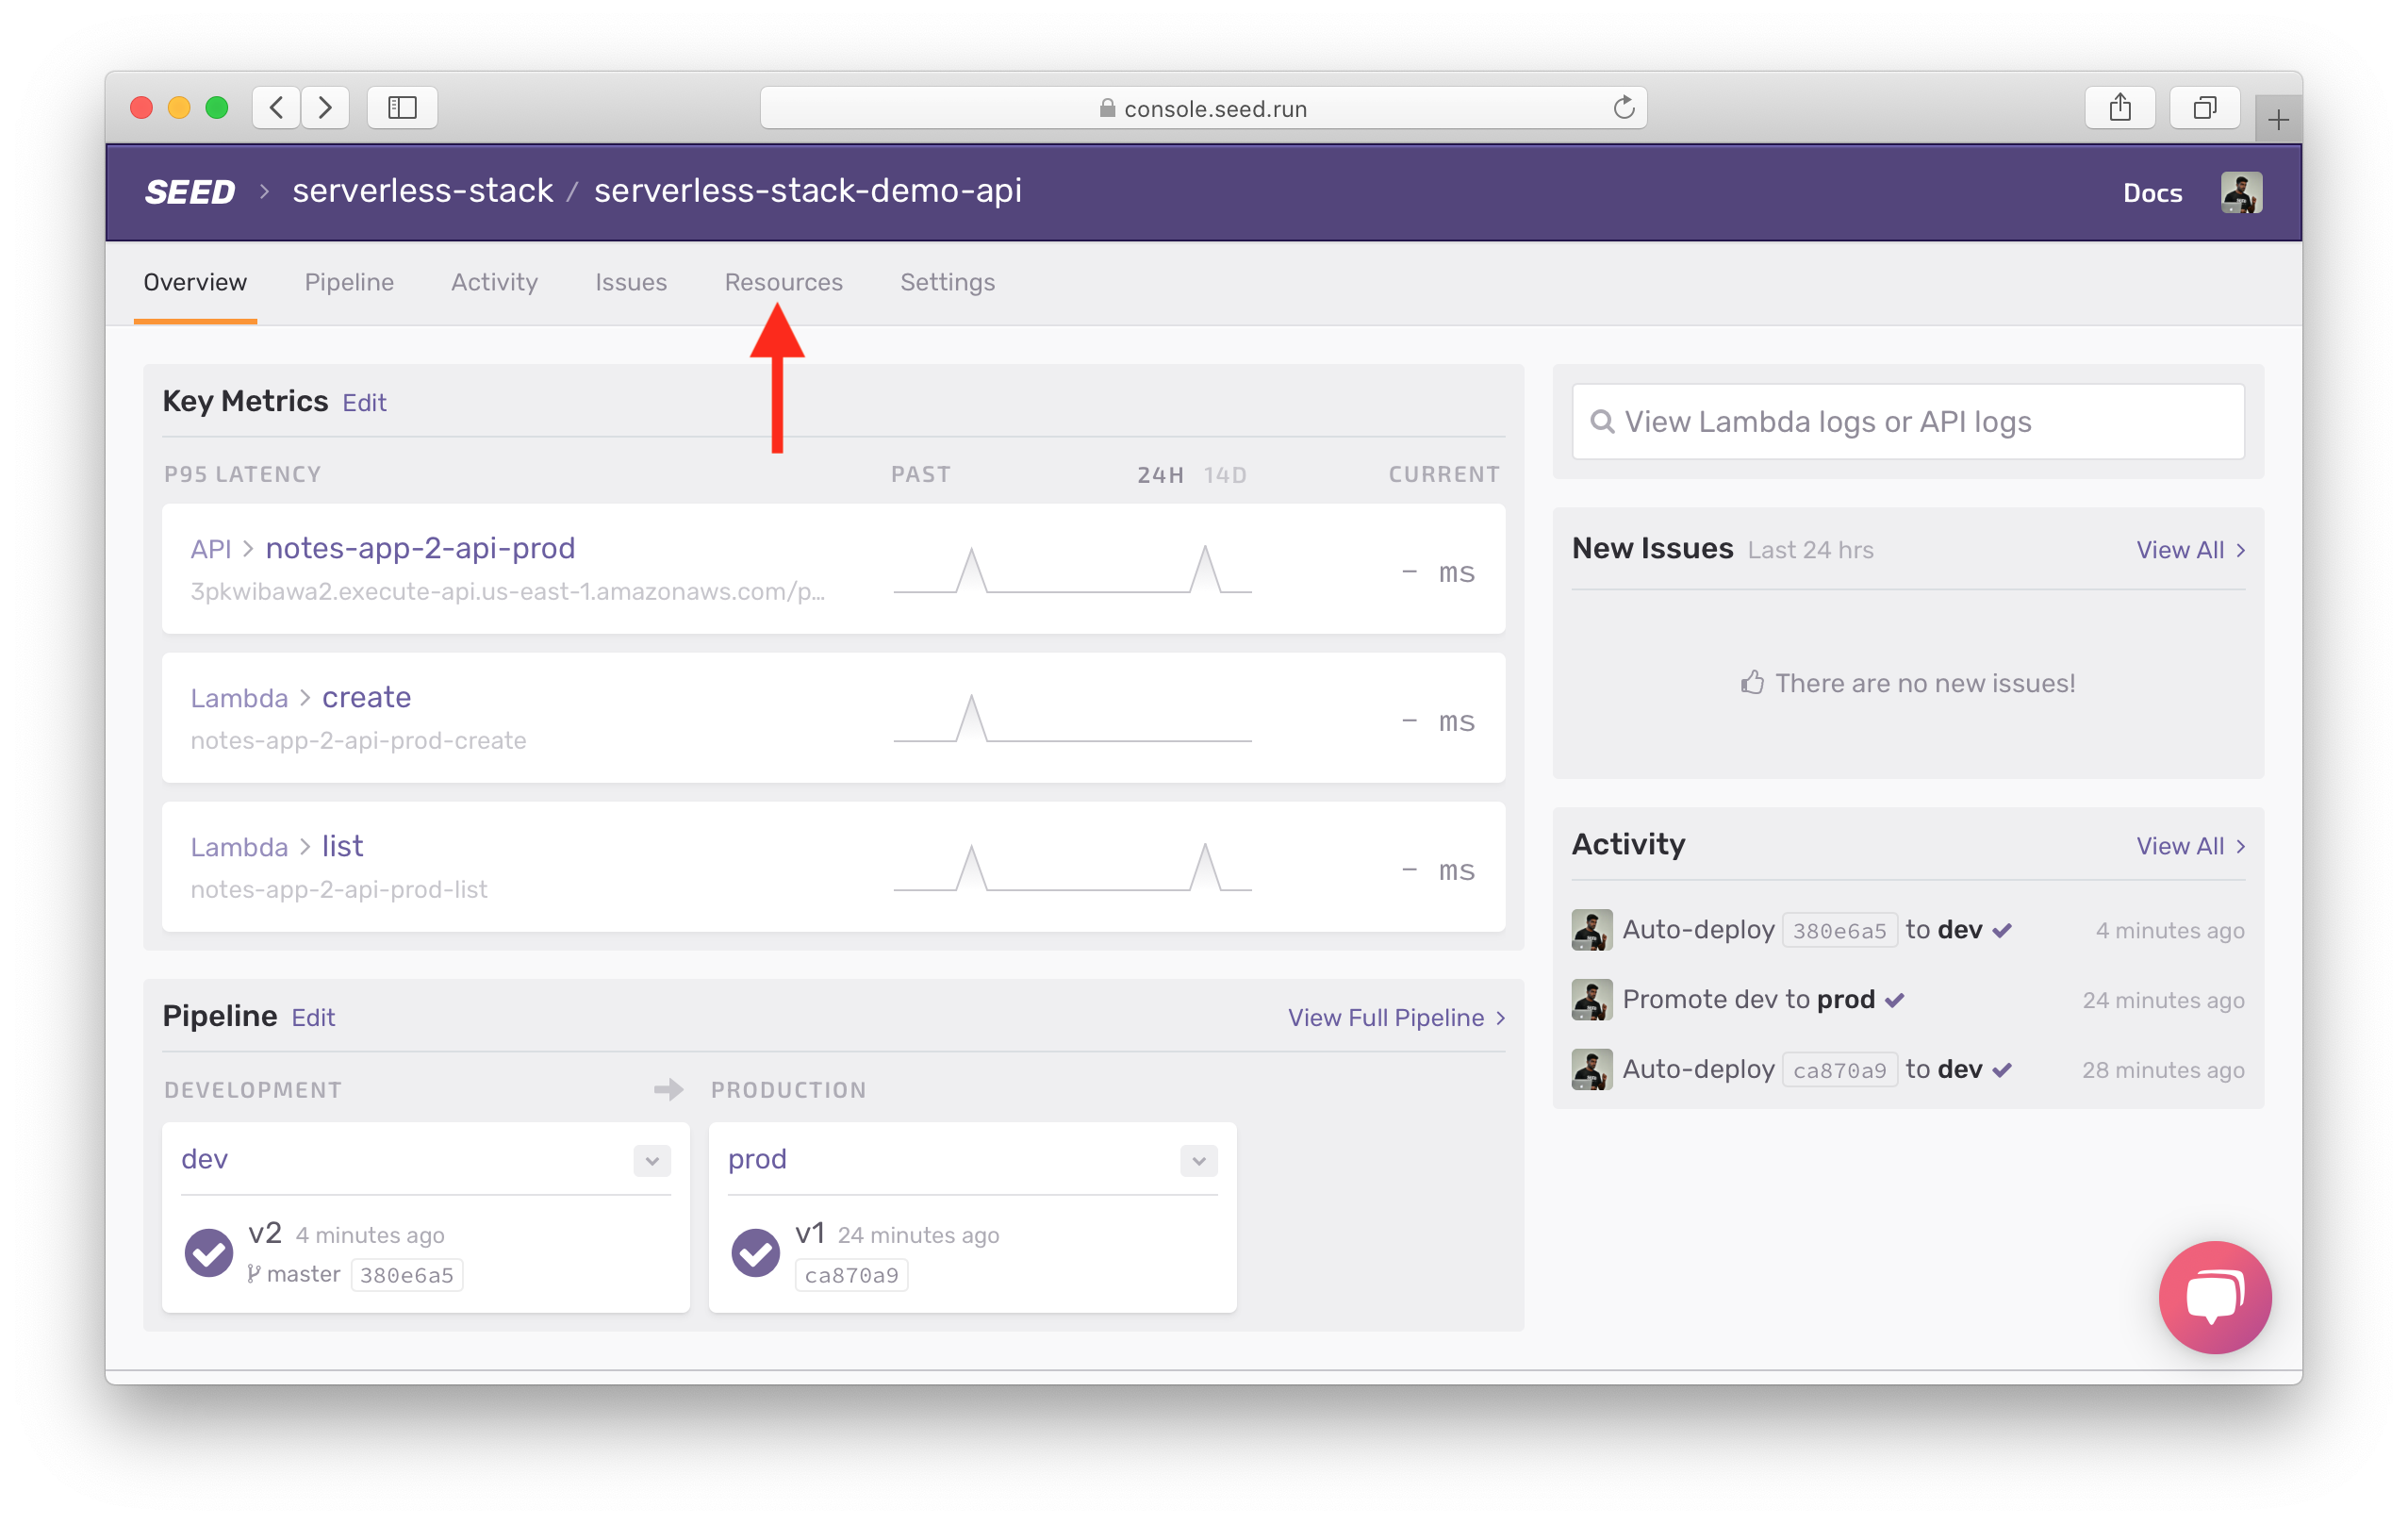
Then hit Enable Access Logs for your API.
And that’s pretty much it! With these simple steps, we are now ready to look at some examples of how to debug our Serverless app.
For help and discussion
Comments on this chapter